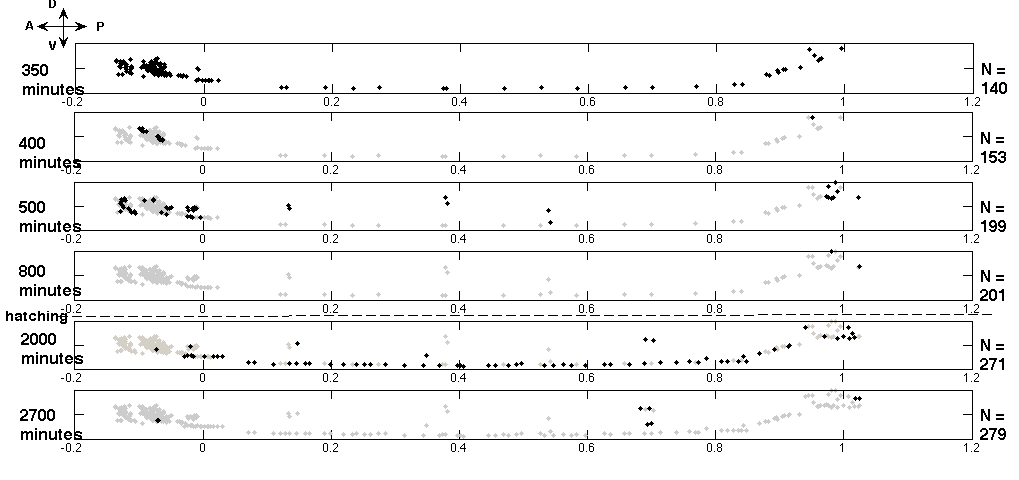
The nematode Caenorhabditis elegans, with information on neural connectivity, three-dimensional position and cell lineage, provides a unique system for understanding the development of neural networks. Although C. elegans has been widely studied in the past, we present the first statistical study from a developmental perspective, with findings that raise interesting suggestions on the establishment of long-distance connections and network hubs. Here, we analyze the neuro-development for temporal and spatial features, using birth times of neurons and their three-dimensional positions. Comparisons of growth in C. elegans with random spatial network growth highlight two findings relevant to neural network development.
First, most neurons which are linked by long-distance connections are born around the same time and early on, suggesting the possibility of early contact or interaction between connected neurons during development. Second, early-born neurons are more highly connected (tendency to form hubs) than later born neurons. This indicates that the longer time frame available to them might underlie high connectivity. Both outcomes are not observed for random connection formation. The study finds that around one-third of electrically coupled long-range connections are late forming, raising the question of what mechanisms are involved in ensuring their accuracy, particularly in light of the extremely invariant connectivity observed in C. elegans.
In conclusion, the sequence of neural network development highlights the possibility of early contact or interaction in securing long-distance and high-degree connectivity.
The article reporting these results is currently in press (Varier and Kaiser, 2010). Earlier work on C. elegans (Kaiser and Hilgetag, 2006), neural network development (Kaiser et al., 2009), and neural network analysis (Kaiser, 2007) is listed below for further reference. Both the current article and the data sets showing the network at different developmental stages will be made available on www.biological-networks.org upon publication (within the next couple of weeks).
Figures
References
Kaiser M and Hilgetag CC. (2006). Nonoptimal component placement, but short processing paths, due to long-distance projections in neural systems. PLoS Comput. Biol. 2:e95. 
Kaiser M, Hilgetag CC, and van Ooyen A. (2009). Random outgrowth and spatial competition generate realistic connection length distributions and filling fractions. Cereb. Cortex 19, 3001-3010.
Kaiser M. (2007). Brain architecture: a design for natural computation. Phil. Trans. R. Soc. A, 365, 3033-3045.
Varier S, and Kaiser M. (in press). Neural development features: Spatio-temporal development of the C. elegans neuronal network. PLoS Comput. Biol. http://www.ploscompbiol.org/home.action