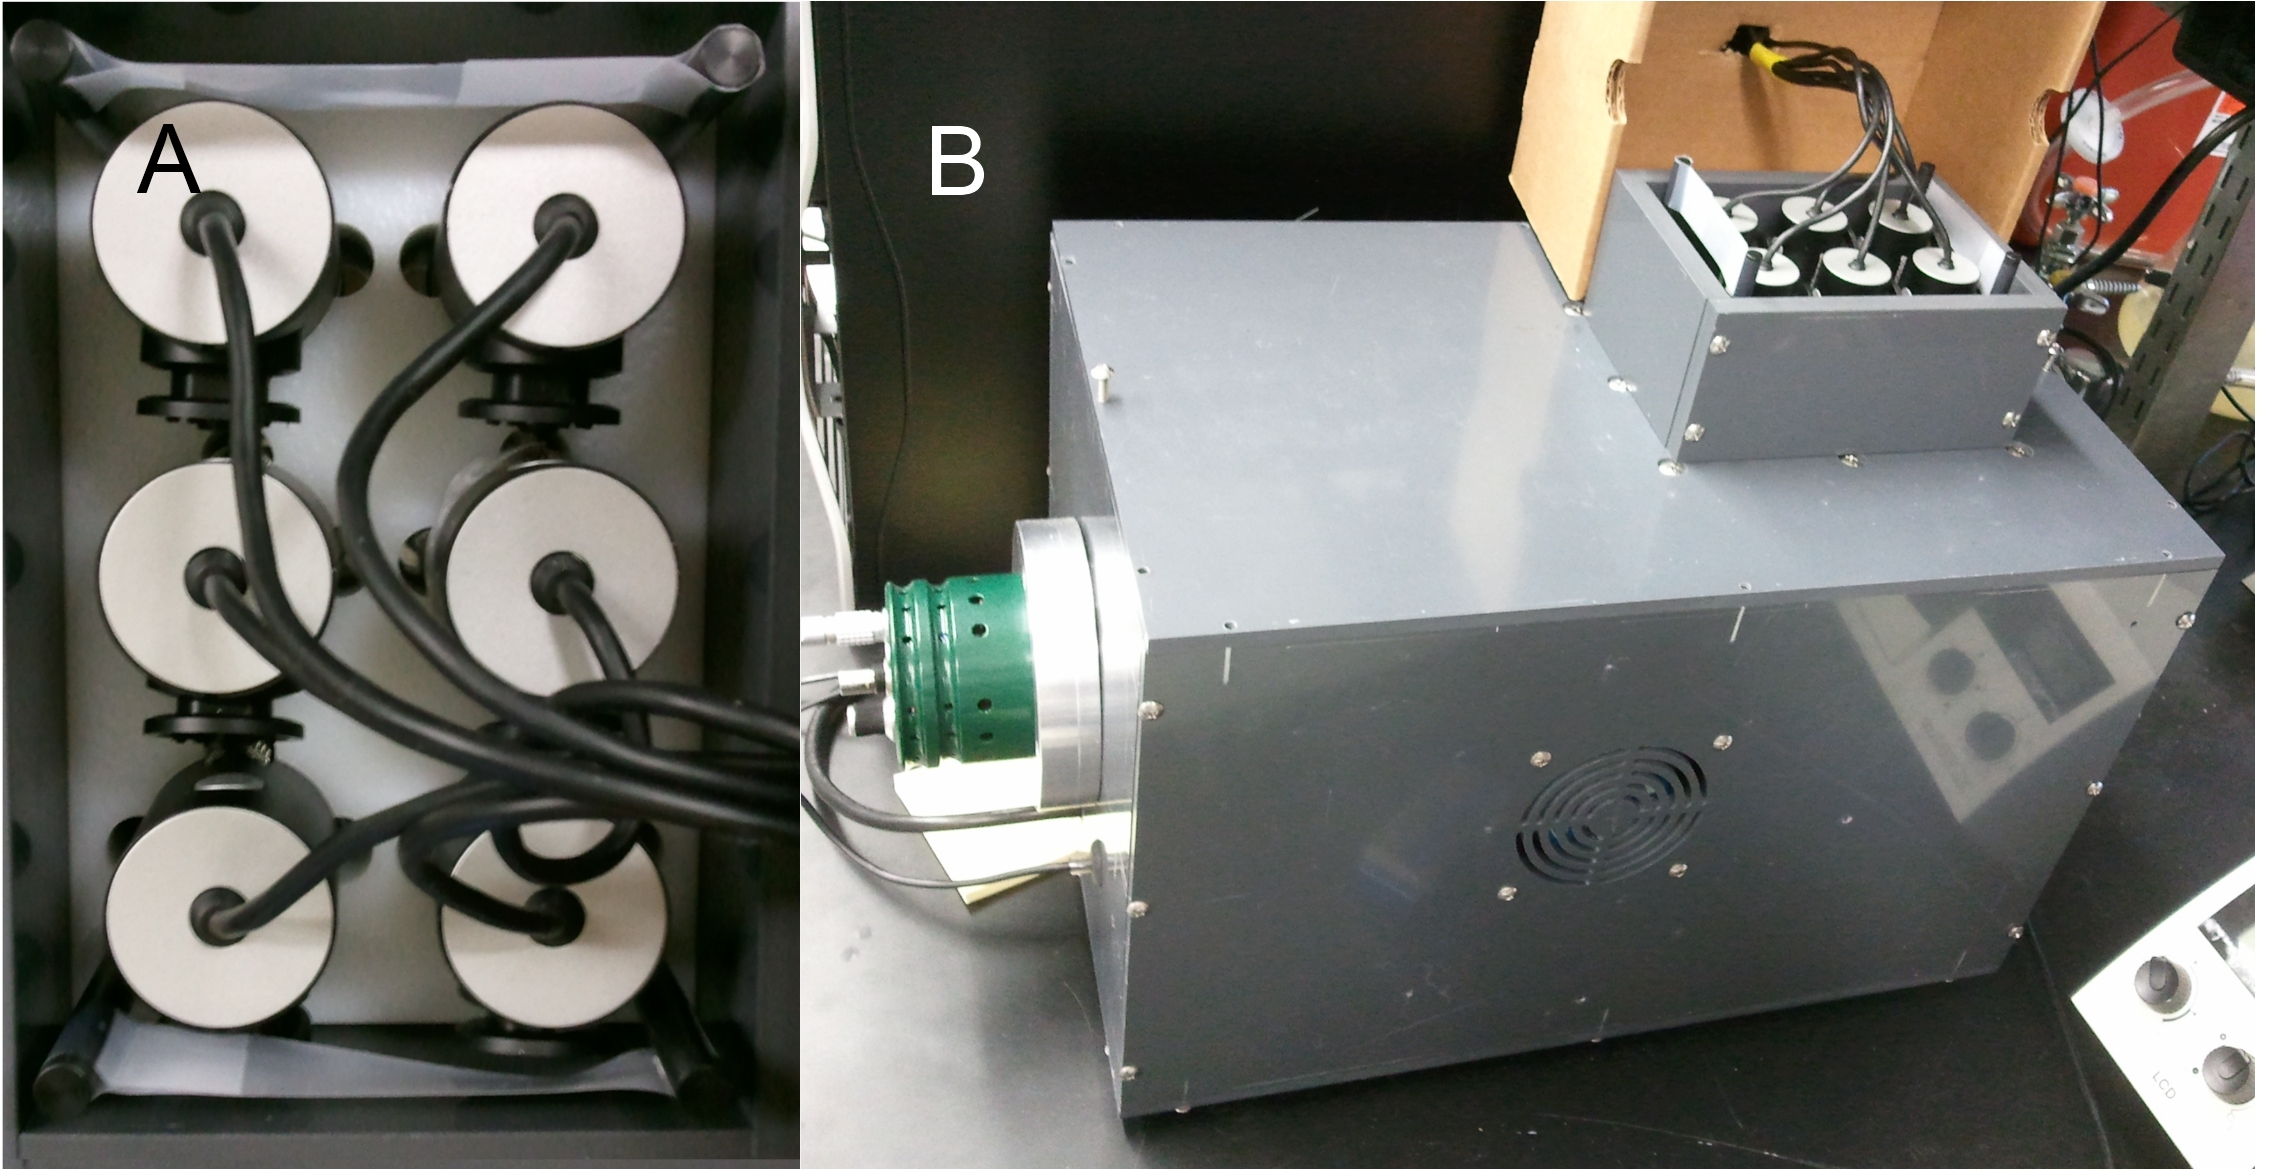
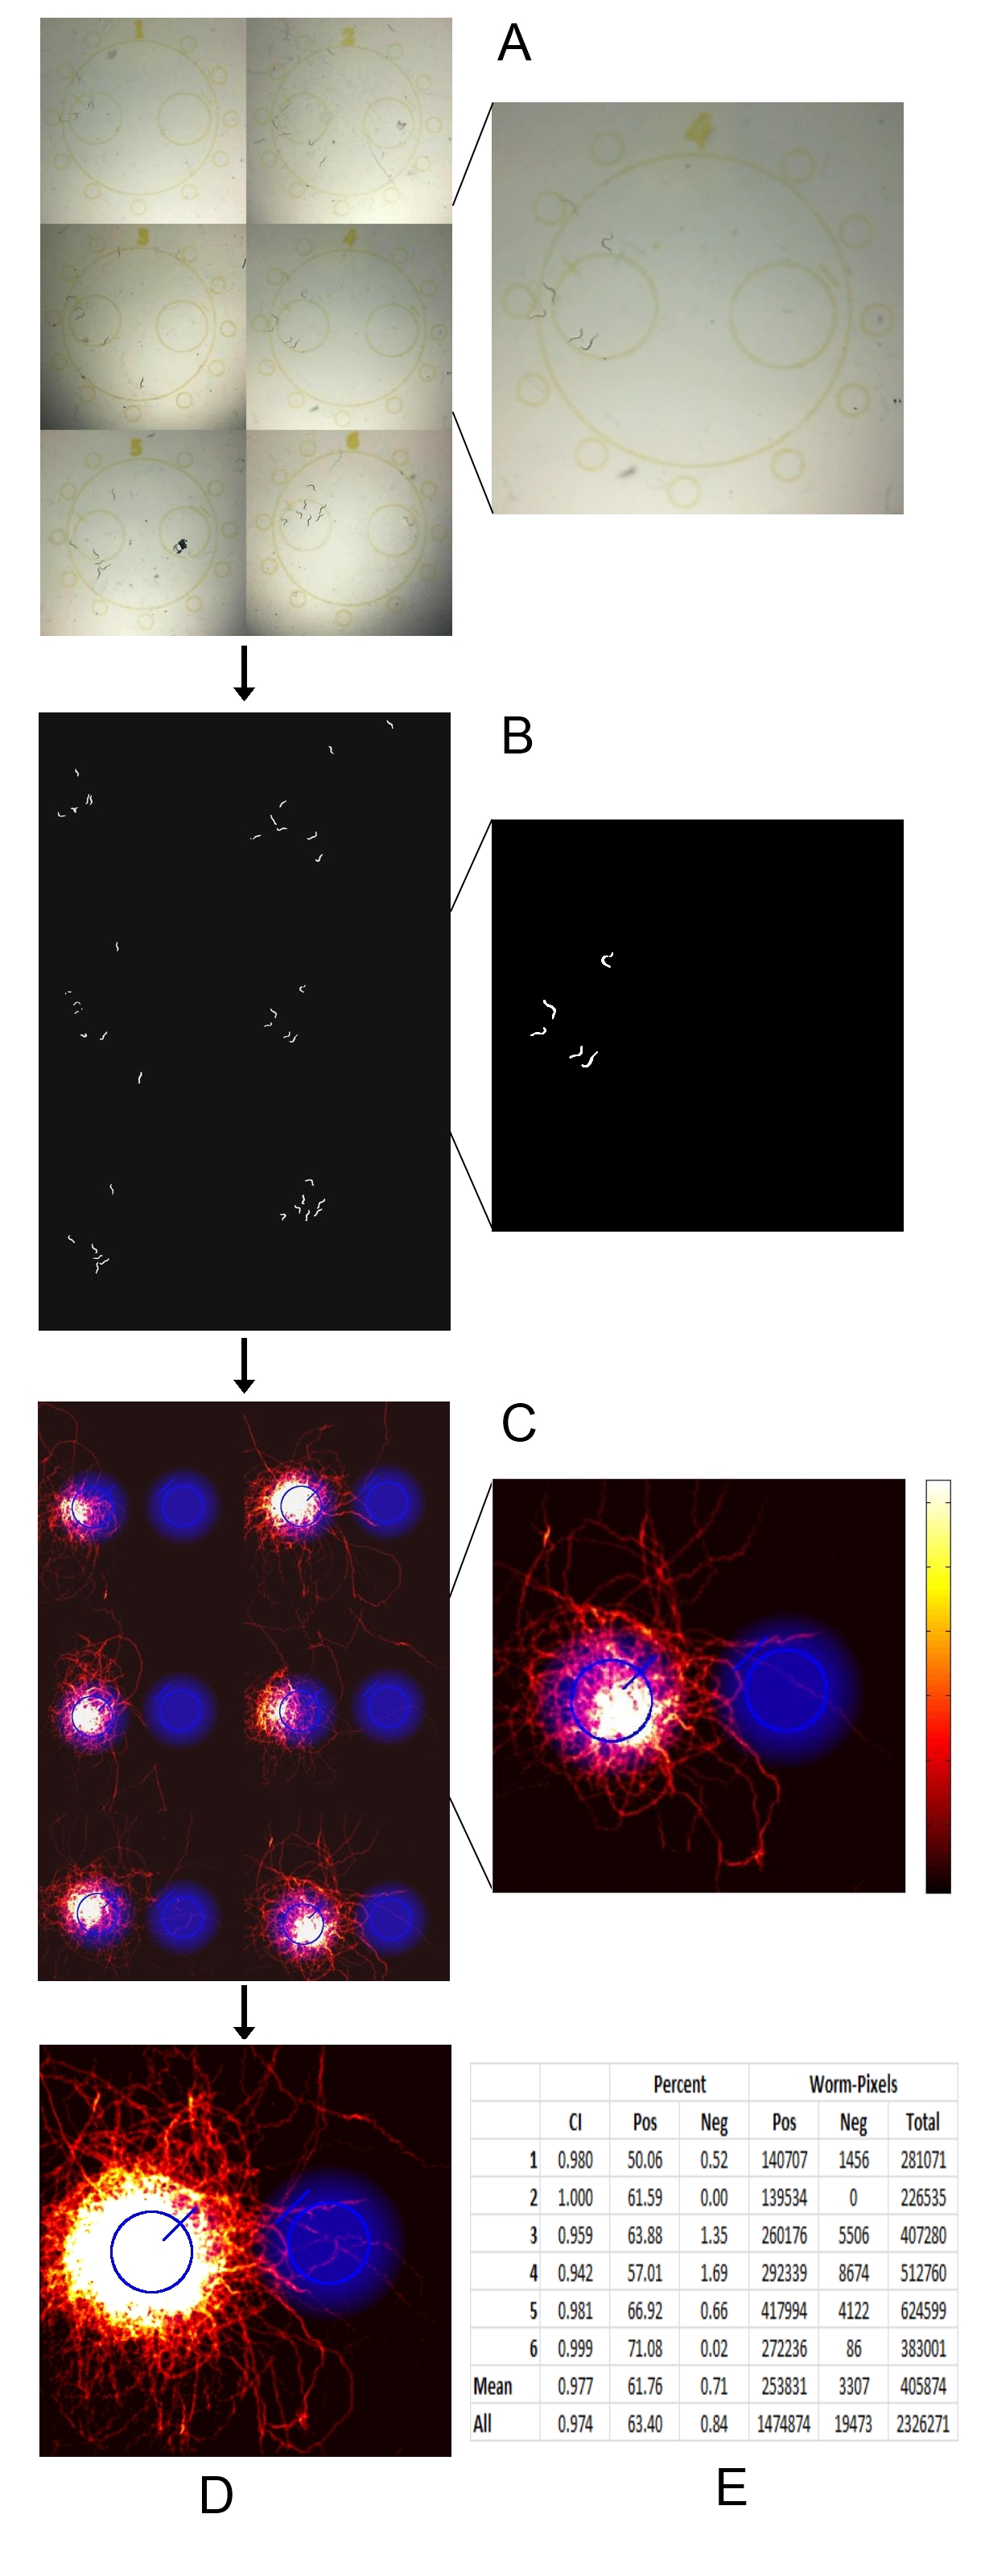
Chemotaxis bioassays are necessary for identifying and characterizing signals that cause attraction or repulsion responses in C. elegans (Ward, 1973). One common method for performing bioassays is to paralyze worms with sodium azide once they reach the material and count the numbers in each area. Another is to record the entire bioassay, which allows you to extract additional data such as detailed spatial information (useful in lawn leaving assays), worm speed, and reversal frequency (Srinivasan et al., 2008; Buckingham and Sattelle, 2008; Bendesky et al., 2011). The downside to this method is its low throughput that is limited by the number of microscopes. We present here a multiple camera recording system using six webcams mounted above a custom made light box which allows the recording of six bioassays simultaneously (Fig. 1). These recordings are processed using a custom MATLAB script which outputs a histogram showing the positions of all worms over the course of the assay. Multiple histograms are summed together using image registration. Test assays were performed using diacetyl (a known attractant), verifying its usefulness in attraction bioassays (Fig. 2).
This apparatus is still under development, and we welcome suggestions from the community on how to improve it. Specifically, we have been unable to connect six cameras to one computer due to limitations in USB bandwidth and are using 2 computers instead. We would also like to be able to record assays with L4 and younger worms, which is currently difficult due to the low contrast of the videos. General methods are described below; details will be described in a further publication.
WormBox Construction
Six Microsoft LifeCam Cinema 720p HD webcams are mounted in a custom holder made of nylon above a PVC lightbox outfitted for brightfield microscopy. The reflector is white photo-quality paper, positioned at an approximately 45° angle. The light was constructed using 7 Philips Luxeon K2 Cool White LEDs. Four cameras are connected via USB 2.0 to a Windows 7 x64 computer with 16GB RAM and two cameras are connected to a Windows XP computer with 4GB RAM. The images from each camera are captured with the MATLAB Image Acquisition Toolbox and saved as often as possible (around 1 Hz).
Video Analysis
The background, which is calculated using principal component analysis, is subtracted from each image. The subtracted images are binarized and cleaned to remove stray pixels and connected components which are too small to be worms. The resultant series of binarized images are summed to generate a histogram, or a record of the locations of all worms across time. Multiple assays are aligned using the scoring regions as control points, and summed. All processing is done in MATLAB.
Acknowledgments
We thank Ryan Newsome and the Florida State University Machine Shop for help designing and for constructing the light box and the UF Center for Smell and Taste for machine shop funds (NIH P30 DC010364). We thank Chaevien Clendinen and Circe Lassegue for help with the project. This work was supported by 1R01GM085285 and 3R01GM085285-01A1S1.
Figures


References
Bendesky A, Tsunozaki M, Rockman MV, Kruglyak L, and Bargmann CI. (2011). Catecholamine receptor polymorphisms affect decision-making in C. elegans. Nature 472, 313-318. 
Buckingham SD and Sattelle DB. (2008). Strategies for automated analysis of C. elegans locomotion. Invertebrate Neuroscience 8, 121-131. 
Srinivasan J, Kaplan F, Ajredini R, Zachariah C, Alborn HT, Teal PE, Malik RU, Edison AS, Sternberg PW, and Schroeder FC. (2008). A blend of small molecules regulates both mating and development in Caenorhabditis elegans. Nature 454, 1115-1118. 
Ward S. (1973). Chemotaxis by the nematode Caenorhabditis elegans: identification of attractants and analysis of the response by use of mutants. PNAS U.S.A. 70, 817-821. 


