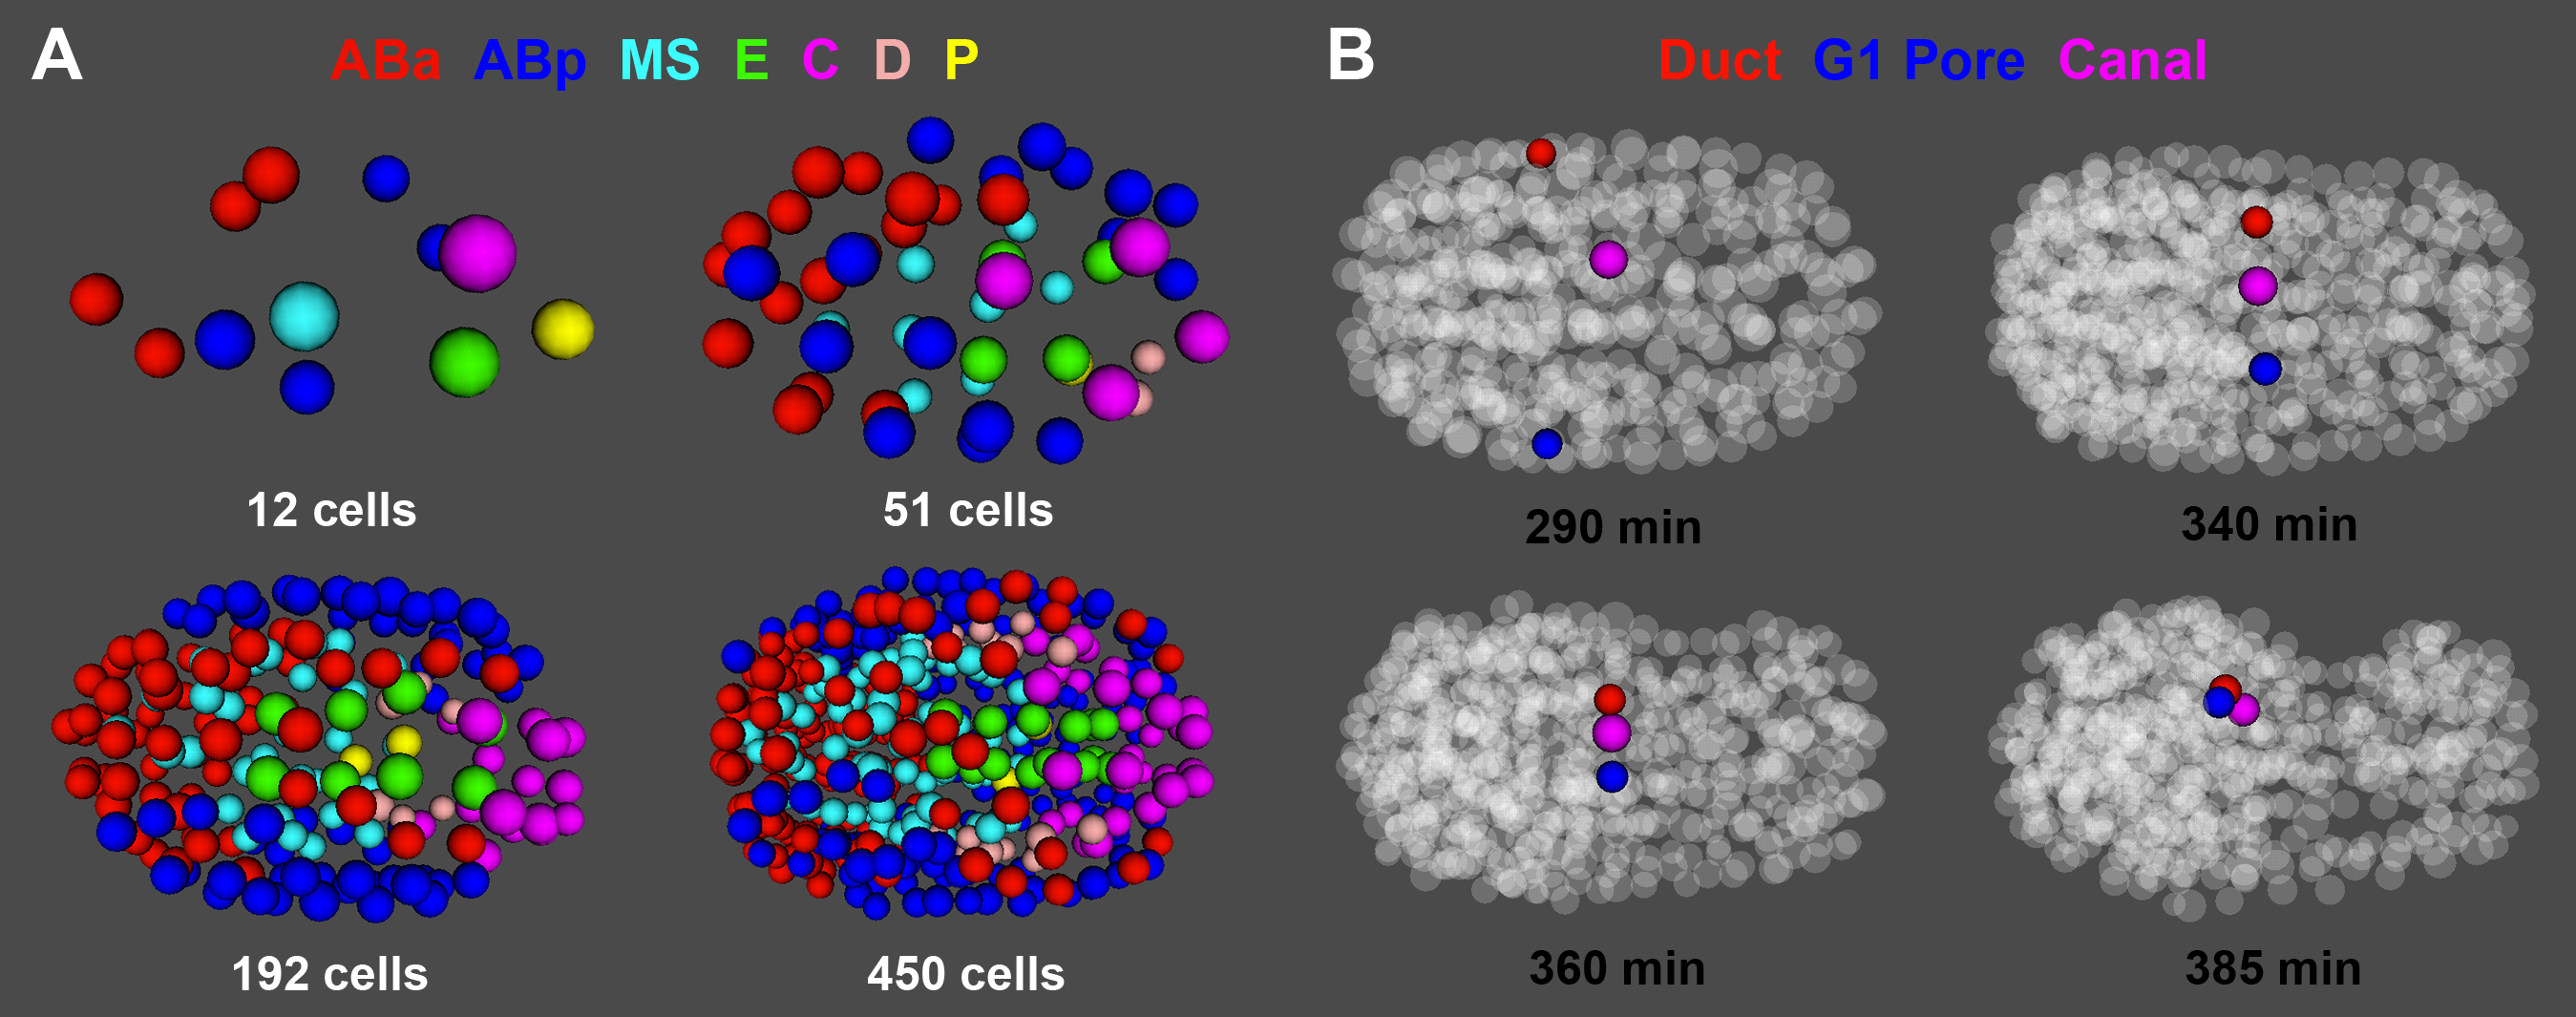
We recently published a quantitative study of normal and temperature-stressed C. elegans embryonic development through the onset of morphogenesis (Richards et al., 2013). Our work included a downloadable 4D model of wildtype development, which is available as supplemental data for the paper, and at our web page at http://www.med.upenn.edu/murraylab/documents/AceTreeModel.zip. This model is based on the cell positions of eighteen wildtype embryos and allows visualization of individual cells, groups of cells or lineages at any point in development through bean stage, approximately six hours after fertilization (Figure 1A). This tool uses a simplified software interface based on AceTree (Boyle et al., 2006) and can be used to visualize the movements and migrations of any cell(s) or lineage(s) of interest (Figure 1B). Although the model is based on the positions of cell nuclei and does not include information on cell-cell contacts, it can be used to identify potential neighbors for cells of interest, which could then be tested for direct contact using other approaches. This approach recently provided insights into the patterning of cells in the excretory system; the migrating duct cell (ABplpaaaapa) reaches the canal cell before the similarly migrating G1 pore (ABprpaaaapa), which may allow the duct cell to respond specifically to a differential LIN-3/EGF signaling event (Abdus-Saboor et al., 2011).
Figures
References
Abdus-Saboor I, Mancuso VP, Murray JI, Palozola K, Norris C, Hall DH, Howell K, Huang K, Sundaram MV. (2011) Notch and Ras promote sequential steps of excretory tube development in C. elegans. Development 138, 3545-3555. 
Boyle TJ, Bao Z, Murray JI, Araya CL, Waterston RH. (2006) AceTree: a tool for visual analysis of Caenorhabditis elegans embryogenesis. BMC Bioinformatics 7, 275.
Richards JL, Zacharias AL, Walton T, Burdick JT, Murray JI. (2013) A quantitative model of normal Caenorhabditis elegans embryogenesis and its disruption after stress. Dev Biol 374, 12-23.
Sulston JE, Schierenberg E, White JG, Thomson JN. (1983) The embryonic cell lineage of the nematode Caenorhabditis elegans. Dev Biol 100, 64-119.