 Embryo series courtesy of Einhard Schierenberg
Table of Contents
Abstract
In recent years, Caenorhabditis elegans has emerged as a new model to investigate the relationships between nuclear architecture, cellular differentiation, and organismal development. On one hand, C. elegans with its fixed lineage and transparent body is a great model organism to observe gene functions in vivo in specific cell types using microscopy. On the other hand, two different techniques have been applied in nematodes to identify binding sites for chromatin-associated proteins genome-wide: chromatin immunoprecipitation (ChIP), and Dam-mediated identification (DamID). We summarize here all three techniques together as they are complementary. We also highlight strengths and differences of the individual approaches.
The major difference between ChIP and DamID is that while ChIP captures DNA associated with a protein at the time of crosslinking, DamID also identifies the DNA that has been bound transiently by the protein. While ChIP is based on the immunoprecipitation of the target by a specific antibody, DamID uses direct modification of the DNA by methylating adenines located close to the binding site. Unlike DamID, ChIP can map epigenetic modifications across the genome. DamID has the advantage of being able to identify binding sites when chromatin complexes are not soluble, very dynamic, or in low abundance.
When choosing between ChIP and DamID, a number of points have to be kept in mind, depending on the target protein, the developmental stage, and the biological question.
First, ChIP requires the availability of an antibody for the protein of interest whereas DamID does not rely on antibodies. Concerns about antibody specificity are therefore irrelevant for DamID (for a more detailed discussion, see Greil et al., 2006). However, posttranslational modifications are not detectable by DamID, which is particularly relevant in studies on histone marks.
Second, while ChIP may need to be optimized for each protein, it is relatively straightforward, once a suitable DamID protocol has been established, to analyze several proteins in parallel without further optimization. For example, in a recent tour de force approach, 112 uncharacterized candidate proteins were screened using DamID, which led to the identification of 42 novel chromatin associated factors in Drosophila melanogaster (van Bemmel et al., 2013).
Third, ChIP physically purifies the DNA interacting with the target, whereas DamID is an enzymatic modification of DNA that gets erased when DNA is replicated. Hence, in early embryos with fast replicating cells, ChIP may be more suited to detect interactions at that developmental stage. Similarly DamID is not suitable to detect dynamic changes in chromatin association during the cell cycle. On the other hand, DamID may be more sensitive to detect transient interactions (Venkatasubrahmanyam et al., 2007).
Fourth, DamID is an in vivo technique where methylation marks are deposited in living cells. On one hand, this avoids potential ChIP artifacts due to chemical crosslinking or other fixatives. On the other hand, DamID requires the introduction of foreign DNA encoding the Dam fusion protein and expression level and localization of the Dam fusion protein need special consideration (see below).
In conclusion, depending on the particular protein of interest, either DamID or ChIP may be the more appropriate method for characterization of binding sites of a given protein. Both ChIP and DamID are potent methods for generating genome-wide information about association of proteins with chromatin. Importantly, comparative studies suggest that the two methods produce similar association profiles, which allow integration of both types of data sets (Moorman et al., 2006; Negre et al., 2006). In C. elegans, a significant overlap was also observed between DAF-16 target genes identified by ChIP and DamID (Schuster et al., 2010) and between ChIP and DamID profiles for nuclear envelope proteins (González-Aguilera et al., 2014).
Both ChIP and DamID are limited by the fact that they use entire animals, hence a mixture of cell types or even developmental stages, as a starting material. This might improve in the future with cell-type specific DamID or nuclei purification, but current protocols have all been developed using entire animals. Making use of the invariant cell lineage of the nematode, adaptation of the lacO/lacI system to visualize binding of transcription factors to specific sequence or localization of genes with single-cell resolution complements ChIP and DamID techniques, exploring cell type specificity of locus localization and nuclear organization.
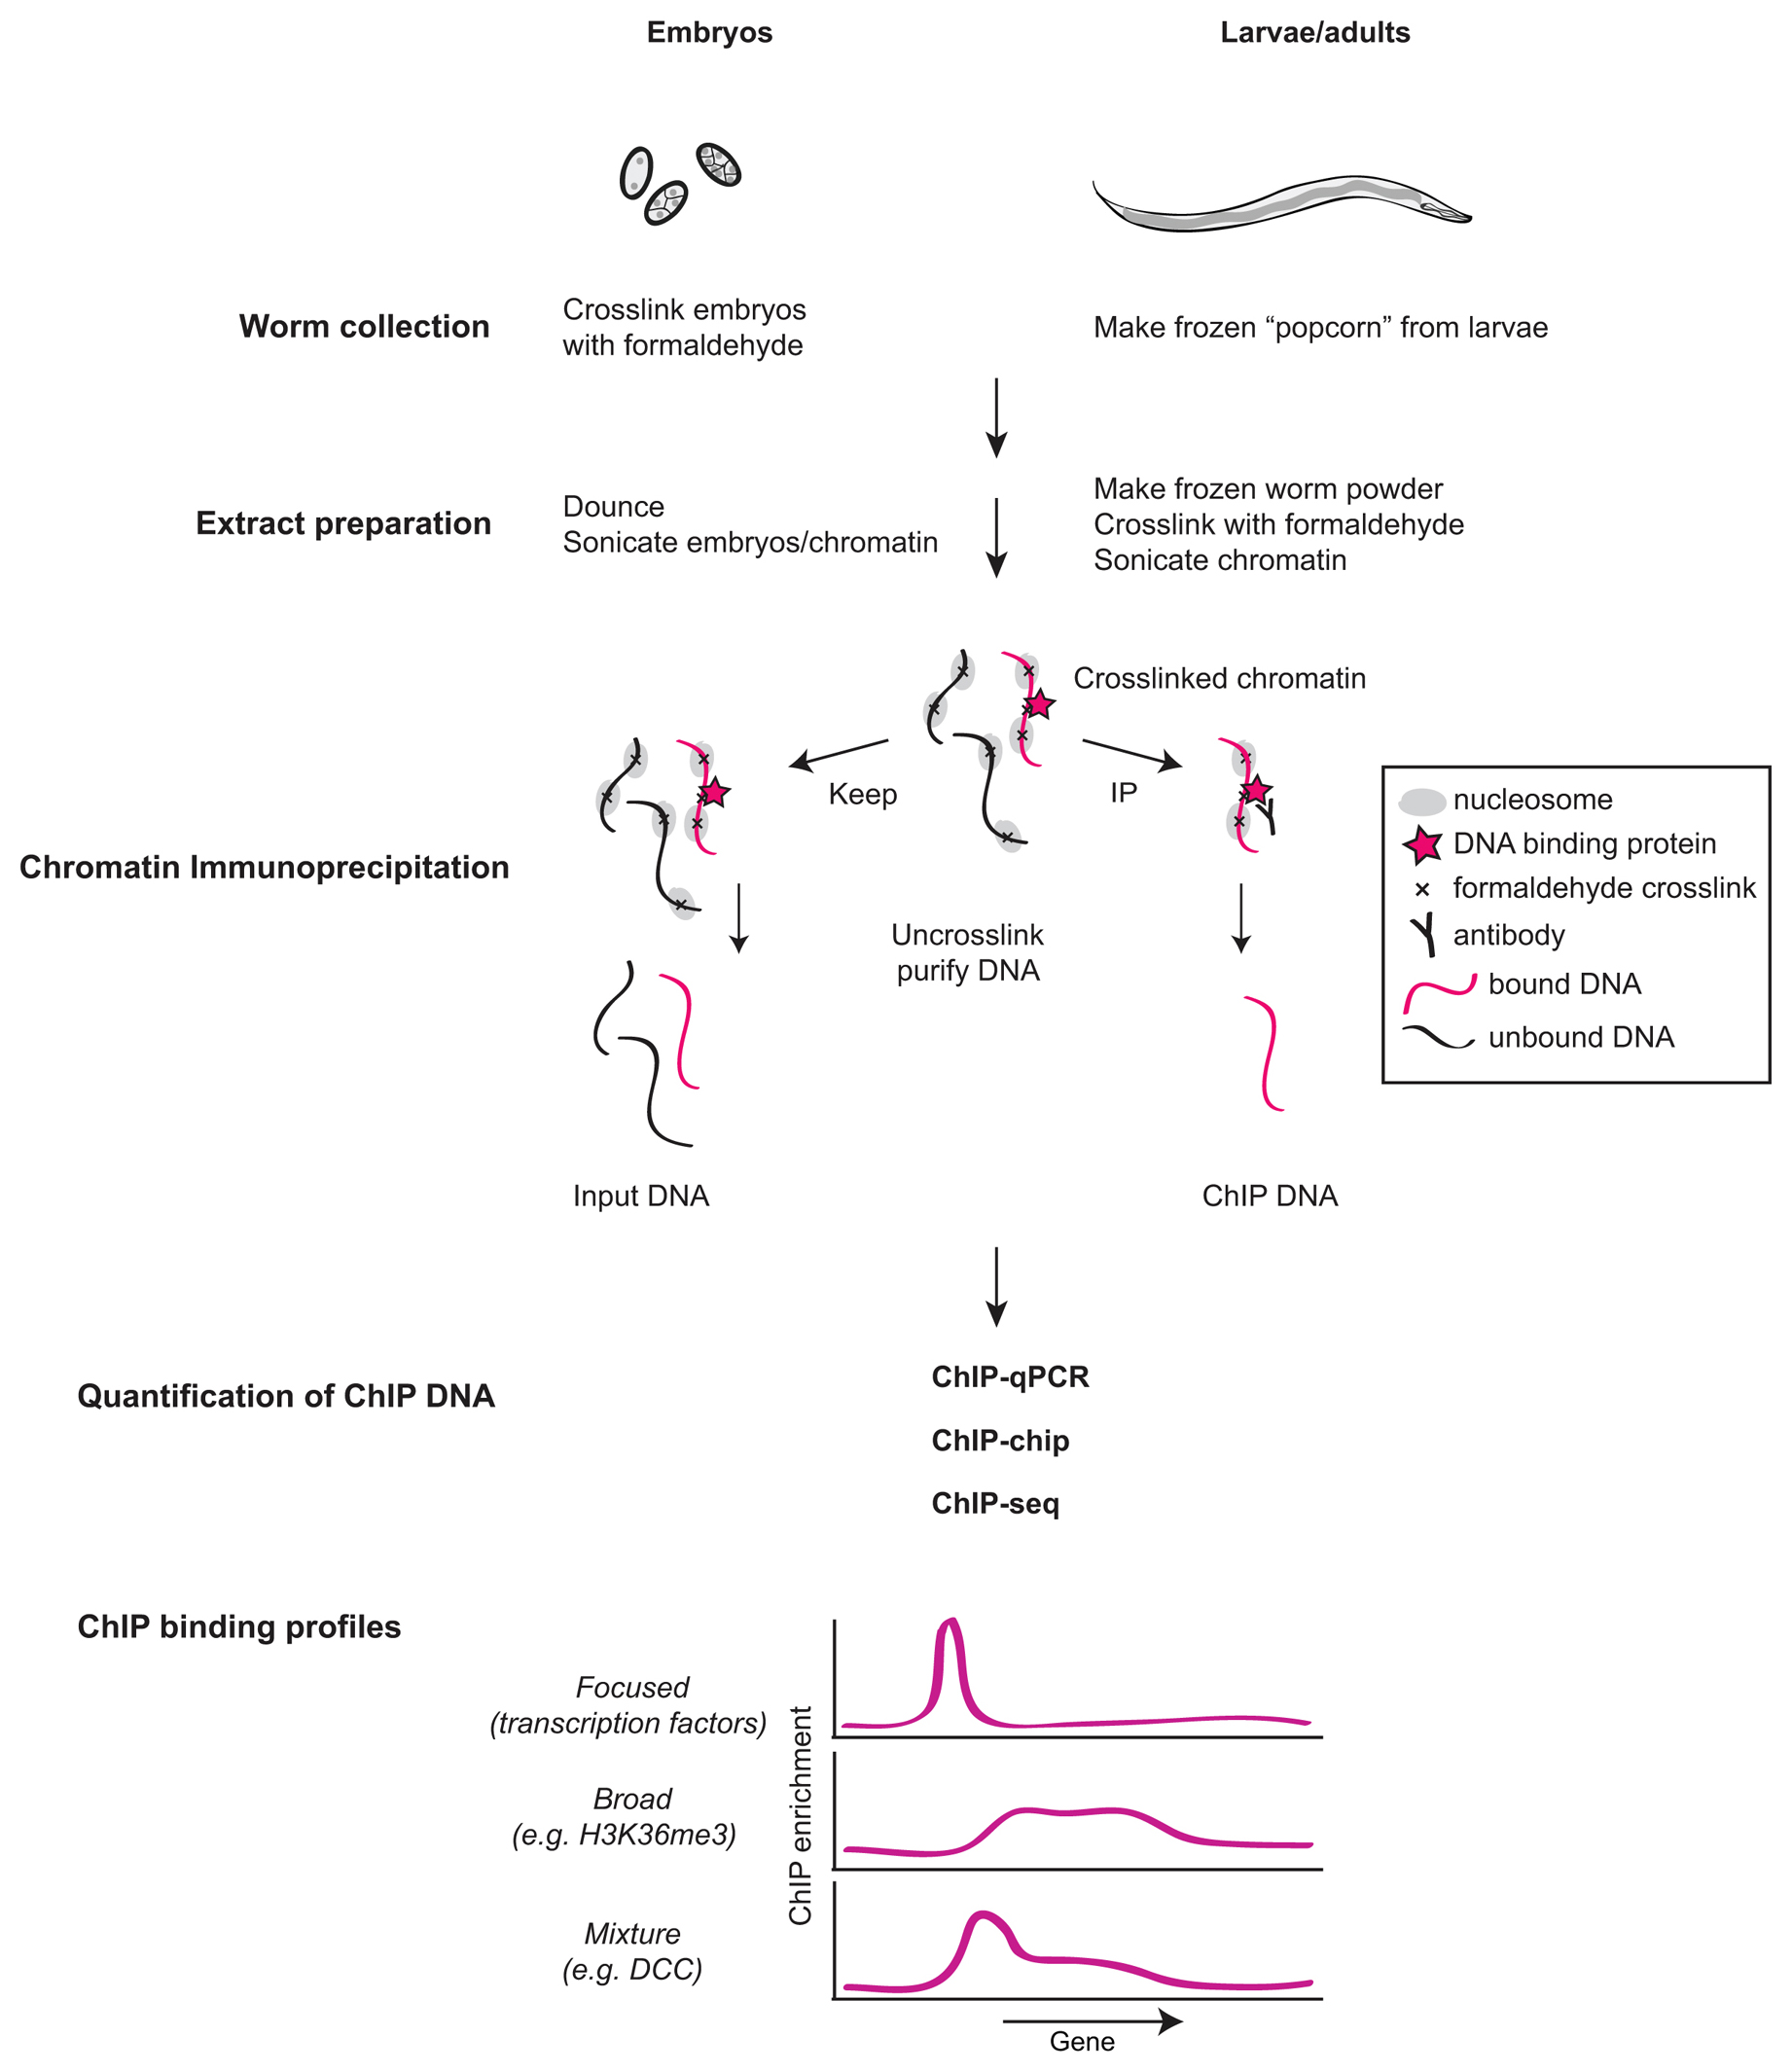
Chromatin immunoprecipitation is a technique that is used to study protein-DNA interactions. Although there are variations in ChIP techniques, the most popular ones rely on the reversible crosslinker formaldehyde (Hecht and Grunstein, 1999; Kuo and Allis, 1999). Briefly, a ChIP experiment is composed of the following steps (Figure 1): (1) worms are incubated with formaldehyde that crosslinks chromatin-associated proteins to each other and to DNA; (2) chromatin is sheared to shorter fragments and the protein of interest is immunoprecipitated along with bound DNA; and (3) bound DNA is identified and quantified.
ChIP measures DNA-protein interactions that are captured by formaldehyde crosslinking in a population of cells. Since formaldehyde crosslinks protein to protein and protein to DNA, ChIP measures both direct and indirect interactions with DNA. The success of a ChIP experiment for your protein of interest (hereafter “target”) depends on many factors. Most important are (1) the nature of the interaction with DNA, (2) abundance of the target, and (3) affinity and specificity of the antibody. Experimental planning will depend on the unique circumstances of your biological question, but below are some common considerations.
|
Figure 1. Experimental steps for chromatin immunoprecipitation (ChIP) analysis of protein-DNA interactions. Embryos are isolated from gravid adults by bleaching and are cross-linked with formaldehyde. Larvae are prepared by breaking frozen popcorn (drops of worms snap-frozen in liquid nitrogen) by grinding or mixer mill before cross-linking. Chromatin is sheared by sonication to a size between 200-1000 bp, and the target protein is immunoprecipitated along with cross-linked DNA using specific antibodies. In parallel, a portion of the extract is taken for Input DNA. Crosslinks are reversed by heat and DNA is purified. ChIP binding is quantified compared to Input DNA using quantitative PCR, DNA microarrays (ChIP-chip) or high-throughput sequencing (ChIP-seq).
Typically, proteins that bind directly to DNA, such as histones and transcription factors, are easier to ChIP, whereas proteins that indirectly bind to DNA and chromatin-modifying enzymes are more difficult to detect by ChIP. Transcription factors that bind to a short DNA sequence motif show a “focused” binding. That is, ChIP enrichment is high at the binding site and declines sharply outside the sonication range (∼200-1000 bp) (Niu et al., 2011). ChIP for histone modifications are generally successful if the antibody is specific and has high affinity to the target (Egelhofer et al., 2011; Liu et al., 2011). Some histone modifications and variants, such as H3K4me3 and H2A.Z, exist in a few nucleosomes that are located at specific regions and show more focused binding (Whittle et al., 2008; Liu et al., 2011) compared to other modifications that associate with the genome “broadly”, such as those associated with gene bodies like H3K36 methylation (Kolasinska-Zwierz et al., 2009; Rechtsteiner et al., 2010; Liu et al., 2011;). ChIP enrichment signals for proteins with broad binding patterns are typically lower (Ikegami et al., 2010). Some proteins can have focused, broad, and a combination of both binding patterns, such as RNA Polymerase II and the Dosage Compensation Complex (Ercan et al., 2007; Whittle et al., 2008; Ercan et al., 2009; Jans et al., 2009).
There are two common approaches to selecting an antibody for ChIP. The first one is to use an antibody against the native protein. The advantage of using an antibody against the native protein is the ability to ChIP the target in its wild-type context. The disadvantage is the difficulty of obtaining specific antibodies or controlling for their specificity. Using two different antibodies to different epitopes in the same target, or analyzing different subunits of the same protein complex helps mitigate specificity problems. If possible, it is best to control for the specificity of the antibody in the context of the ChIP experiment, as summarized in Section 2.2.4, Controls. In our hands, rabbit polyclonal antibodies have been most successful. If possible, one should test the ability of the antibody to immunoprecipitate its target specifically. This is usually a good indication for if the ChIP will work. Antibody specificity should be tested using assays such as western blot and immunofluorescence and comparing wild type to mutant or RNAi signal (Rechtsteiner et al., 2010; Landt et al., 2012). However, some antibodies that work for ChIP may not work in these assays (Egelhofer et al., 2011), and western blot and immunofluorescence analysis do not guarantee that the antibody will be specific within the ChIP assay. A large number of antibodies recognizing histone modifications were tested by the modENCODE groups and the validation data is available at http://compbio.med.harvard.edu/antibodies/.
Another approach for immunoprecipitation is to use an affinity tag. In this approach, a transgenic worm expressing the tagged target is used for ChIP (Niu et al., 2011). GFP-3XFlag tag was successfully used for tagging transcription factors (Niu et al., 2011) and for MES-4 histone methylase (Rechtsteiner et al., 2010). Custom made GFP antibodies were used by modENCODE, but a commercial ChIP-grade rabbit polyclonal GFP antibody is available (Abcam, Ab290). If the Flag is exposed, M2 anti-FLAG (Sigma-Aldrich® F3165) can also be used (Rechtsteiner et al., 2010). The advantage of using tagged targets is to bypass requirement for a specific antibody and control for specificity using an untagged strain as a negative control. Moreover, the existing GFP-tagged transgenic strains can be used (Sarov et al., 2012). If a tagged protein is chosen as the target, one should consider issues such as tag interference with binding, and expression at incorrect levels or incorrect tissues.
Most ChIP experiments have been performed with whole embryos or larva. If your target is found in a specific tissue, it is best to developmentally synchronize worms to enrich for that tissue. Tissue specific ChIP is desirable, but not yet common. It is possible to perform ChIP using a tagged target expressed in the tissue of interest (Kudron et al., 2013), or by purification of nuclei from the tissue of interest (Steiner et al., 2012).
Choice of negative control differs according to the antibody. If an antibody recognizing the native protein is used, an ideal negative control is repeating the ChIP in a null mutant in which the target is not present. For essential proteins this is not possible, thus an unspecific antibody such as IgG is commonly used as a negative control. If a tagged target is used for ChIP, ChIP in an untagged strain is the best negative control. Positive controls may be chosen based on several genome-wide ChIP data that are available in literature and through http://www.modencode.org/, the modENCODE consortium website (Gerstein et al., 2010). The number of experimental replicates depends on the range of difference that needs to be quantified, but a minimum of three biological replicates is desirable. We find that technical replicates are less important as they are often highly correlated with each other.
There are currently three methods for ChIP quantification, ChIP-qPCR, ChIP-chip and ChIP-seq. If the goal for ChIP quantification is to determine amount of binding at a specific locus (e.g., comparing wild type vs. mutant), ChIP-qPCR can be used. If the goal is to determine genome-wide binding sites, ChIP-chip or ChIP-seq are the methods of choice. In all three techniques ChIP enrichment is compared to Input DNA, therefore analysis of the Input DNA is necessary. We discuss qPCR, microarray and sequencing options for ChIP and DamID in the section following DamID below.
Approximately 100-200 µl of embryos, and ∼1-2 ml of larva (adults) give enough extract for a few ChIPs.
Bleach gravid adults until few or no adult pieces are visible.
Wash embryos three times with M9.
Resuspend ∼500 μl embryos in 45 ml M9.
Add formaldehyde to a final concentration of 2% (2.8 ml of 37%).
Incubate by rocking at room temperature for 30 minutes.
Quench formaldehyde by adding glycine to final 125 mM (2.5 ml of 2.5 M), and incubate 5 min.
Centrifuge 3000 g for 2 min. Remove supernatant.
Resuspend pellet in M9. Centrifuge 3000 g for 2 min. Remove supernatant.
Transfer to microfuge tubes with PBS + protease inhibitors, spin at 6000 g for 1 min, remove supernatant.
Wash once more with 1 ml PBS + protease inhibitors, spin at 6000 g for 1 min, remove supernatant and store at −80°C.
Clean up larva by settling and washing with ∼20X volume of M9 three times.
Wash larva with equal volume of PBS + protease inhibitors, spin at 3000 g for 1 min, remove supernatant.
Resuspend in equal volume of PBS + protease inhibitors.
Using 1 ml pipette tip, drip larva mix into a 100 ml beaker that contains liquid nitrogen. Do not hold the tip on top of the liquid nitrogen very long, the worms may freeze in the tip. This is to make frozen larva “popcorn”.
Chill a 15 ml tube in liquid nitrogen, and pour popcorn into the 15 ml tube.
Let liquid nitrogen evaporate, but do not thaw the popcorn at any step until crosslinking. Close cap loosely and store at −80°C.
Resuspend ∼100 μl of embryos (volume estimated when embryos are collected) in 500 μl FA buffer + 0.1% sarkosyl* + protease/phosphatase inhibitors.
Spin down at top speed for 10 seconds. Remove supernatant.
Resuspend in 1 ml FA buffer + 0.1% sarkosyl + protease/phosphatase inhibitors.
Dounce on ice (30 strokes) using a glass dounce homogenizer pestle type B.
Transfer to a 15 ml polystyrene tube. Make sure that embryos are well suspended and are at the bottom of the tube. Sonicate using Bioruptor settings: 4°C, 15 min on High, 30 sec on 30 sec off.
Transfer samples to microfuge tubes and spin at top speed (13,000-17,000 g) for 15 min at 4°C. Take the supernatant, and put aside. Resuspend pellet in 0.5 ml FA buffer + 0.1% sarkosyl + protease/phosphatase inhibitors. Sonicate again.
Transfer samples to microfuge tubes and spin at top speed for 15 min at 4°C. Take supernatant, combine with the first supernatant. Discard pellet.
Determine the protein concentration of the supernatant by Bio-Rad assay.
Take 25 μl aliquot to determine the extent of DNA shearing (DNA purification below).
Continue with the next step or aliquot and snap freeze the ChIP extract in liquid nitrogen and store at −80°C.
*Sarkosyl: this may reduce efficiency of some mouse monoclonal antibodies, but helps to obtain a tight range sonication in Bioruptor.
Caution: Do not let the frozen worm popcorn thaw before crosslinking.
Estimate popcorn weight.
Grind worms into a frozen powder. 2 methods are:
a) Mortar and pestle
Grind popcorn to a fine powder in cryo-mortar and pestle. This takes ∼10 min of vigorous grinding. During grinding, periodically add more liquid nitrogen to keep the sample frozen. Check under dissecting scope that there are no whole worms left. For adults, breaking on average of 4 pieces is enough.
b) Mixer Mill
You can use a cryo-mill (e.g., from Retsch) to break the worms. Take ∼4 grams (2 mls of settled worms) of frozen worm popcorn, place in prechilled 50 ml cup and add one 25 mm ball. Submerge in liquid nitrogen to chill. Mix for 15 sec at 25 Hz. Open the chamber and collect sample using a tapered spatula. Check that most worms are broken into a few pieces. If not, break for another 15 sec at 25 Hz.
Transfer worm powder to 10 volume of 1.1% formaldehyde in PBS + protease and phosphatase inhibitors (1.1 ml of 37% formaldehyde + 36 ml of PBS).
Incubate at room temperature for 10 min with rocking. Make sure all the worms are dissolved.
Quench formaldehyde by adding glycine to a final concentration of 125 mM, and incubating 5 min at room temperature.
Centrifuge 4000 g for 3 min at 4°C. Remove supernatant.
Resuspend pellet in cold PBS + 1 mM PMSF and spin at 4000 g for 3 min.
Resuspend pellet in 1 volume of popcorn weight FA buffer + 0.1% sarkosyl + protease/phosphatase inhibitors.
Distribute 1 ml into a 15 ml polystyrene tube. Sonicate and process as in the embryo protocol above.
Add 1 µl of 0, 0.5, 1, 2, 4, 8 mg/ml BSA to 800 μl of water. Add 1 or 2 μl of extract to 800 μl of water. Add 200 μl Bradford reagent (BioRad #500-0006) and incubate at room temperature 5 min. Transfer to spec cuvettes and measure at 595 nm. Plot standard curve and calculate extract concentration.
Add 1 μl RNaseA to 25 μl of extract and digest RNA at 37°C 1 h. Add 225 μl of ChIP elution buffer (250 mM NaCl, 1% SDS, 10 mM Tris.Cl pH 8, 1 mM EDTA). Add 2 μl of proteinase K and incubate at 50°C for 1-2 h. Incubate overnight at in 65°C water bath to reverse crosslinks. Next day purify DNA using Qiagen PCR purification kit. Run DNA on 1% agarose gel to check shearing. The majority of the sheared chromatin should be between 200-1000 bp in length. We do not recommend re-sonicating frozen extract, thus we recommend optimization of the sonication conditions before the experiment.
Thaw extract on ice. Aliquot 0.5-2.0 mg of extract from embryos, or 2-4 mg of extract from larvae. The amount is chosen based on target amount and how well the antibody works. For high amount of target protein (e.g., histone modifications) or if you get high background signal, try using less extract. Some recommendations are below:
Add FA buffer + 0.1% sarkosyl + protease/phosphatase inhibitors to bring the volume up to 440 μl.
Centrifuge at 4°C 5 min at top speed. Transfer the supernatant to new tubes.
Take 5% of the extract as Input. Place at freezer until next day.
Add antibody (1-5 μg) to the rest of the sample and incubate while rotating at 4°C overnight.
Take 40 μl of protein A (or G, depending on antibody) coupled to sepharose beads (GE Healthcare) or to magnetic beads (Dynabeads®, LifeTechnologies) or custom-affinity beads, per ChIP sample and equilibrate using FA buffer. Add 1 ml FA buffer, invert a few times, spin at 2500 g for 1 min, remove supernatant. Repeat this wash a total of four times. After the washes, resuspend the beads in one bed volume of FA buffer.
Add 40 μl beads to each ChIP sample and rotate at 4°C, 2 h.
Wash beads at room temperature by adding 1 ml of each of the following buffers and incubating on a rotator. Collect beads by spinning for 1 min at 2500 g. (If magnetic or custom beads are used, collect beads by the appropriate method). Remove supernatant by pipetting.
• 2 times FA buffer for 5 min.
• 1 time FA-1 M NaCl for 5 min.
After this wash, transfer beads to new tubes with the next wash buffer.
• 1 time FA-500 mM NaCl for 10 min.
• 1 time TEL buffer for 10 min.
• 2 times TE for 5 min.
9. To elute the immunocomplexes, add 125 μl ChIP Elution Buffer and place the tube in a 65°C heat block for 15 min. Vortex briefly every 5 min. Spin down the beads at 6000 g for 1 min and transfer the supernatant to a new tube. Repeat elution and combine supernatants.
10. Add 200 μl Elution Buffer to inputs. Add 2 μl of 10 mg/ml Proteinase K to ChIP and Input samples, and incubate ∼1 h at 50°C heat block.
11. Reverse crosslink overnight at 65°C water bath.
12. Purify DNA using Qiagen PCR purification kit. Elute in 50 μl Qiagen Elution buffer. We do not typically quantify ChIP DNA, because we found no correlation between amount of DNA and the ChIP signal/noise ratio. When an antibody produces high background, DNA amount would be high, but the specific enrichment may be low.
For qPCR we use 2 μl (Real-Time) or 5 μl (Agarose gel) of the 50 μl ChIP DNA. For ChIP-seq library preparation, we use half of the ChIP and 10 ng of Input DNA.
FA buffer:
50 mM HEPES/KOH pH 7.5, 1 mM EDTA, 1% Triton™ X-100, 0.1% sodium deoxycholate; 150 mM NaCl
FA-1 M NaCl buffer:
50 mM HEPES/KOH pH 7.5, 1 mM EDTA, 1% Triton X-100, 0.1% sodium deoxycholate; 1 M NaCl
FA-500 mM NaCl buffer:
50 mM HEPES/KOH pH 7.5, 1 mM EDTA, 1% Triton X-100, 0.1% sodium deoxycholate; 500 mM NaCl
TEL buffer:
0.25 M LiCl, 1% NP-40, 1% sodium deoxycholate, 1 mM EDTA, 10 mM Tris-HCl, pH 8.0
Prepare 500 ml of FA and TE, 250 ml of FA-500 mM NaCl, FA-1 M NaCl, and TEL buffers, filter sterilize and store at 4°C.
ChIP Elution buffer:
1% SDS, 250 mM NaCl, 10 mM Tris pH 8.0, 1 mM EDTA
Prepare 50 ml and store at room temperature.
100X protease inhibitors-Calbiochem® (cat. #539131)
100X protease inhibitors-Calbiochem (cat. #524624)
Keep inhibitors on ice, and add to the FA buffer fresh before use.
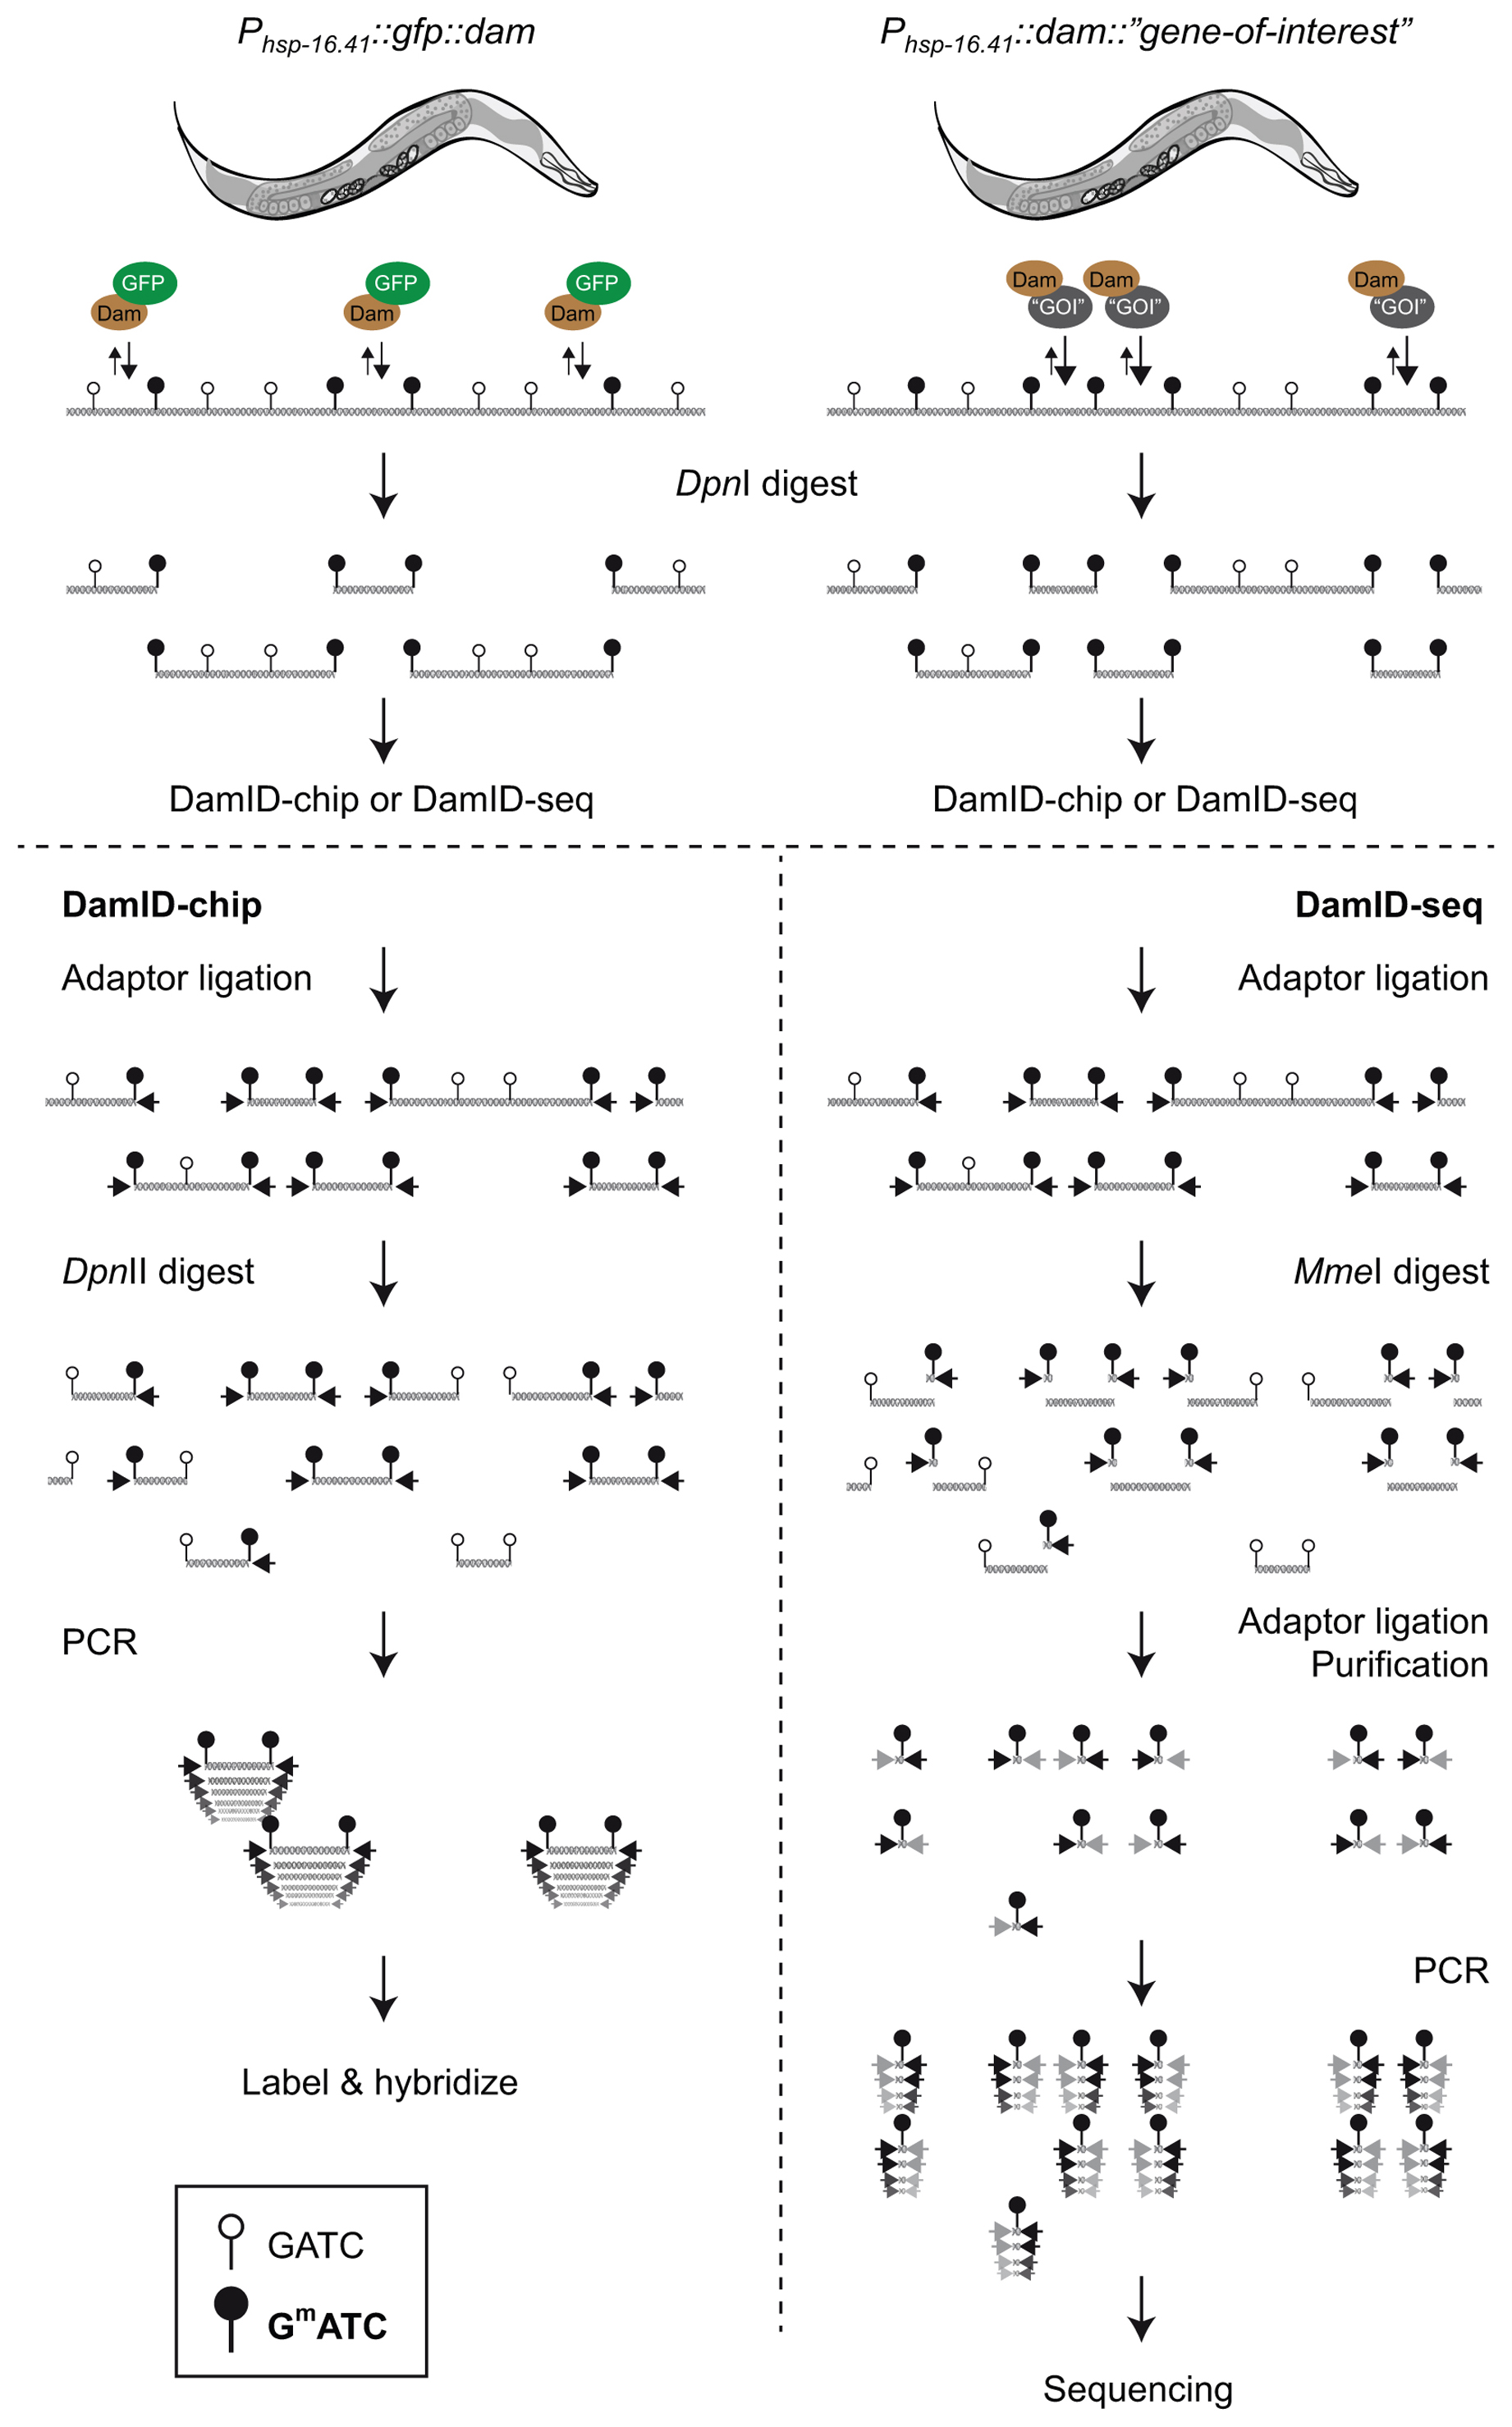
DamID was developed by Bas van Steensel and Steven Henikoff as an alternative to ChIP for mapping of protein interaction sites within DNA (van Steensel and Henikoff, 2000). DamID is based on the fusion between DNA adenine methyltransferase (Dam) from Escherichia coli and a protein of interest that either binds chromatin directly or indirectly as part of a protein complex. When the fusion protein is expressed in vivo, the Dam tag will methylate adenines in the immediate vicinity of the binding sites of the chromatin-associated protein. Dam recognizes GATC motifs and creates a unique adenine methylation mark (GmATC) not normally found in the DNA of eukaryotes. Through a series of enzymatic reactions methylated sites are amplified, and can be identified by array or sequencing techniques (Figure 2). The principle of DamID is simple—genomic DNA is extracted from animals expressing Dam fused to the protein of interest (assay) and animals expressing a fusion of Dam to GFP (control for DNA accessibility). Methylated sites are cut by a restriction enzyme, DpnI, that recognizes specifically GmATC. DpnI cut sites are then ligated to an adaptor before cutting non-methylated GATC sites with DpnII. PCR using the adaptor as a primer amplifies fragments between GmATC sites. Microarray hybridization or sequencing of amplicons reveals the ratio of methylation between the assay and the control.
Many chromatin-associated proteins, such as transcription factors, recognize short DNA sequences, whereas the nuclear lamina contacts domains of few to hundreds of kilobases. ChIP and DamID experiments typically provide resolution in the range of 0.5-2 kilobases (Vogel et al., 2007). Shearing of genomic DNA fragments is the main determinant of resolution in ChIP, whereas density of GATC sequences and spreading of Dam activity to nearby recognition sites set the limit in DamID. C. elegans has 269,049 GATC sequences per haploid genome (Sha et al., 2010), corresponding to an average density of one site for every 373 bp.
DamID has proven successful in many species, including budding and fission yeast (Venkatasubrahmanyam et al., 2007; Woolcock et al., 2011), Arabidopsis thaliana (Germann et al., 2006), D. melanogaster (van Steensel and Henikoff, 2000; van Bemmel et al., 2013), and cultured mouse and human cells (Song et al., 2004; Vogel et al., 2006). The versatility of the method is illustrated by the variety of protein classes for which DNA association sites have been mapped, ranging from transcription factors (Orian et al., 2003; Song et al., 2004), repressor elements (Negre et al., 2006; Vogel et al., 2006), components of the RNAi machinery (Woolcock et al., 2011), histones (Braunschweig et al., 2009), nuclear pore proteins (Kalverda and Fornerod, 2010) to nuclear lamina associated proteins (Pickersgill et al., 2006; Steglich et al., 2012).
In C. elegans, DamID has been used to identify target genes for the transcription factor DAF-16 (Schuster et al., 2010), as well as to map chromatin anchored to the nuclear envelope (Towbin et al., 2012; González-Aguilera et al., 2014). In addition, Fire and coworkers used Dam (without fusing it to a chromatin-associated protein) to probe the structure of the C. elegans genome for enzymatic accessibility (Sha et al., 2010).
|
Figure 2. Principles of DamID analysis of protein-DNA interactions. In vivo expression of trace amounts of DNA adenine methyltransferase (Dam) fused to a chromatin-associated protein (“gene-of-interest”) generates specific methylation marks (GmATC) normally not found in C. elegans. As control for DNA accessibility, a strain expressing GFP-Dam is analyzed in parallel. Genomic DNA (gDNA) is purified and incubated with DpnI restriction enzyme to specifically cleave Dam-methylated GmATC sites. Depending on whether DNA arrays (DamID-chip; left) or high-throughput sequencing (DamID-seq; right) is used to identify methylated DNA, different oligonucleotide adaptors are ligated to the cleaved ends. For DamID-chip both samples are digested with DpnII enzyme to cut all non-methylated GATC sequences (for simplicity only one sample is shown). This generates a pool of DNA fragments, of which only the ones that are flanked by two GmATC sequences without intervening non-methylated sites can serve as PCR templates. Finally, amplified DNA fragments from the two strains are identified and quantified by co-hybridization to DNA arrays. Alternatively, for DamID-seq short tags for sequencing are generated by using adaptors with a recognition site for a restriction enzyme that cuts 19-27 nt from the recognition site (e.g., MmeI). After digestion, a second adaptor is ligated to the tags, which are then amplified by PCR. One or several purification steps are included to isolate ∼120 bp DNA fragments, which are identified by high-throughput sequencing.
Because DamID is based on ectopic expression of Dam fused to your protein(-s) of interest, it is important to consider carefully which developmental stage and/or tissue type is most relevant for your purposes. Generally, you want to set up your experiments in cells that normally express your protein.
High expression of Dam causes extensive methylation of the adenines in the genome, which increases the background signal and may have adverse effects on cell metabolism. Therefore, keeping expression to a minimum is necessary to obtain a high signal/noise ratio. A typical approach to do this is to express the Dam-target under the control of a weak promoter, such as an inducible promoter in non-inducing conditions (Greil et al., 2006; Schuster et al., 2010).
In principle, any protein can be fused to Dam to test for possible direct or indirect DNA interaction which expands the range of proteins for which the method is relevant (van Bemmel et al., 2013). Importantly, the consequences of truncations or point mutations on the DNA association activities of the test protein can be analyzed by comparing DamID profiles from wild-type and mutant Dam fusions. Although experiments are generally performed using full-length proteins, isolated DNA binding domains can be tested as well (van Steensel and Henikoff, 2000). Because expression of the Dam fusion protein should be maintained very low, both genomic DNA and cDNA sequences can be employed for cloning. As in the original Drosophila DamID constructs, Dam fusions in C. elegans can be driven by heat shock promoters from which basal transcription produces little but sufficient amounts of Dam fusion protein (Schuster et al., 2010; Towbin et al., 2012). Schuster and coworkers used the hsp-16.1 promoter, and we used the hsp-16.41 promoter to control expression of Dam::DAF-16 and Dam::LMN-1, respectively. The basal activities of these two promoters have not been evaluated in different tissues, but both promoters drive expression in most if not all cell types (Stringham et al., 1992; Rohner et al., 2013). The Dam protein can be added to either the N- or the C-terminus of the protein of interest. The size of Dam is equivalent to GFP and if any information exists as to whether your protein tolerates better the addition of a N- or a C-terminal tag, this may guide the design of the Dam fusion (see next section). We have used the classical 3’UTR from the unc-54 gene in our DamID constructs but choosing other 3’UTRs could potentially be used to alter the relative signal contribution by different cell types in whole-animal DamID (Mangone et al., 2010). Finally, to minimize variation in expression levels between different DamID strains, we recommend that transgenic strains be generated by MosSCI (Frokjaer-Jensen et al., 2008) or alternative single-copy integration techniques. This may be particular relevant if you plan to compare several fusion proteins.
Recombination during transgenesis may lead to production of a truncated fusion protein. For transgenic strains obtained by MosSCI, single copy insertion of full-length transgenes should ideally be validated by Southern blot or PCR-based methods. Additionally, incorrect processing of the chimeric transcripts may lead to aberrant localization or expression compared to their endogenous counterparts. When using hsp promoters in the design of DamID strains, the low transcriptional activity that is used during the DamID experiment should not produce detectable signal in immunofluorescence (IF) or Western blot (WB). This is a good control to ensure that your fusion protein is not overexpressed. Upon heat shock however, clear IF and WB signals should be detected and used to control for correct processing and localization.
To address correct expression issues, a Myc epitope is typically included as linker between Dam and the protein of interest, although other detection methods, of course, can be used. IF and WB analysis with anti-Myc antibodies are suitable methods to verify correct fusion protein localization and processing, respectively.
DamID experiments in C. elegans were performed in young embryos (Towbin et al., 2012) or adult hermaphrodites (Schuster et al., 2010; González-Aguilera et al., 2014), although in principle any developmental stage can be studied. Tissue-specific DamID has not been reported yet, but one can imagine purifying nuclei or cells from a particular tissue (Fox et al., 2007; Steiner et al., 2012; Von Stetina et al., 2007) in animals expressing a Dam fusion throughout their body. To prevent amplification of contaminating bacterial DNA in the DamID protocol, using a dam-E. coli strain as food source when growing the nematode cultures is recommended (Sha et al., 2010; Towbin et al., 2012).
Accessibility of Dam to methylate its target GATC sequence depends on chromatin compactness and nucleosome positioning (van Steensel and Henikoff, 2000; Sha et al., 2010). “Dam only” controls are therefore included in DamID protocols and used as baseline subtraction for fusions between Dam and the protein(-s) to be analyzed. “Dam only” controls should be placed under control of the same promoter and 3’UTR as the Dam fusion genes, and may consist of Dam alone or Dam fused to a fluorescent protein, such as GFP, allowing easy validation of expression. Alternatively, Dam could be fused to a mutant version of the test protein unable to interact with its target DNA (Luo et al., 2011). To serve as control for DNA accessibility, the “Dam only” protein should be nuclear. GFP::Dam (i.e., GFP fused to the N-terminus of Dam) fulfills this criteria (Sha et al., 2010; González-Aguilera et al., 2014), whereas Dam::GFP does not show nuclear localization (Schuster et al., 2010). Being a relatively new technique in the C. elegans field, only three DamID data sets have been published that may serve as positive controls (Schuster et al., 2010; Towbin et al., 2012; González-Aguilera et al., 2014). However, because identification of DNA association sites is usually done by hybridization to high-content arrays followed by detailed bioinformatics analysis, positive controls are both expensive and laborious and are usually omitted. Instead, DamID experiments should include at least three biological replicates (also for the “Dam only” control), and one should observe a high correlation coefficient between the replicates (Schuster et al., 2010; Towbin et al., 2012; González-Aguilera et al., 2014).
Similarly to ChIP, DamID-amplified DNA fragments can be quantified by qPCR, DNA arrays, or direct sequencing. qPCR requires prior knowledge about the DNA elements associated with the protein of interest and is mostly suitable when a limited number of DNA fragments are to be analyzed (Venkatasubrahmanyam et al., 2007). In contrast, arrays and sequencing methods provide genome-wide information about binding sites. These methods are discussed in more detail below.
Insert your gene (cDNA or genomic fragment) into a suitable vector containing an inducible promoter with low basal activity, the dam open reading frame, and a robust 3’UTR (e.g., the vector pBN61[unc-119(+) Phsp-16.41::dam::myc::MCS::unc-54 3’UTR] (González-Aguilera et al., 2014)).
We have successfully used the MosSCI method to insert single copies of Dam fusion transgenes into the C. elegans genome (Frokjaer-Jensen et al., 2008; Towbin et al., 2012). Alternatively, strains can be generated by bombardment (Schuster et al., 2010), although variability between strains may be higher.
Outcross transgenic lines with wild-type nematodes at least twice prior to validation and DamID.
For proteins that are expressed during embryogenesis, this life stage provides the best material for validation of localization (by IF) and size of expressed fusion protein (by WB). For larval and adult nematodes the protocols below may need modification. All steps are at room temperature unless indicated otherwise.
Heat shock young adults for 1 h at 33°C and leave to recover for 2 h at 20°C. Include transgenic animals that have not been heat shocked and wild type animals as controls.
Transfer 6-8 animals into 3 μl of M9 on a polylysine-coated slide (Crittenden and Kimble, 1999). Use more M9 if cutting the animals cannot be done quickly; otherwise all liquid will evaporate. Using two 25-gauge syringe needles, cut the animals in the middle, allowing embryos to extrude from the animal. Cover the sample with a 12 x 12 mm coverslip. Gently remove excess liquid with a paper towel if needed; embryos should be squeezed (but not squashed!) by the coverslip.
Put slides on metal blocks on dry ice for 15 min or store at -80°C.
Flick off cover slip with a scalpel and submerge slides immediately in -20°C methanol—leave for 15-18 min.
Transfer slides to PBST (PBS with 0.1% Tween®-20)—leave for 15 min.
Transfer slides to fresh PBST—leave for 15 min.
Dry slides as much as possible but it is critical that the embryos do not dry out, as this will ruin the staining.
Make a circle around embryos with Vaseline®.
Block slides in 40 μl PBST-F (PBST with 10% Fetal Calf Serum)—leave for 30 min in a wet chamber (e.g., plastic box with wet paper towels). Remove solution by aspiration.
Dilute α-Myc antibody in PBST-F (e.g., Sigma-Aldrich, cat. #C3956 rabbit α-Myc diluted 1:100) and add 40 μl to each slide. Ideally, include an additional primary antibody as staining control. If your protein localizes to a specific nuclear structure or compartment, the control antibody should label this too. Leave for 2 h at room temperature or overnight at 4°C in wet chamber.
Wash for 1 min in PBST.
Wash for 30 min in PBST.
Wash for 30 min in PBST.
Dry slides as before. Reapply Vaseline.
Add 40 μl secondary antibodies diluted in PBST-F (e.g., Invitrogen™, cat. #A21071 goat anti-rabbit Alexa Fluor® 633–conjugated antibody diluted 1:1000 plus a suitable fluorescently labeled antibody to visualize your control primary antibody). Leave in darkness for 2 h at room temperature or overnight at 4°C in wet chamber.
Wash for 1 min in PBST.
Wash for 30 min in PBST.
Wash for 30 min in PBST.
Rinse quickly with PBS.
Dry slides as before. Remove Vaseline.
Mount with Mowiol® anti-fading mounting medium containing 5 μg/ml Hoechst 33258 (e.g., 30 μl/24 x 24 mm coverslip).
1.Heat shock two 60 mm NGM plates of synchronized young adults for 1 h at 33°C and leave to recover for 2 h at 20°C. Include transgenic animals that have not been heat shocked and wild type animals as controls.
2.Harvest embryos by standard hypochlorite treatment (1 N NaOH, 30% bleach solution). Dilute a small aliquot (e.g., 1 μl) to determine number of embryos in each sample and adjust to similar concentration if needed. Approximately 2000 embryos should be loaded per lane.
3.Disrupt embryos by boiling and vortexing in SDS sample buffer together with 0.5 μm-diameter glass beads for 5 min.
4.Separate by SDS–PAGE and transfer to appropriate membrane according to standard protocols.
5.Block membrane (e.g., with PBS containing 0.05% Tween-20 and 3% low-fat milk for 30 min).
6.Incubate for 2 h with α-Myc primary antibody (e.g., Sigma-Aldrich, cat. #C3956 diluted 1:400).
7.Wash membrane with PBS containing 0.05% Tween-20.
8.Incubate for 2 h with appropriate secondary antibody (e.g., Sigma-Aldrich cat. #A0545 peroxidase-conjugated anti-rabbit antibody diluted 1:5000).
9.Wash membrane and develop according to manufacture's instructions.
DamID experiments should be performed on synchronized cultures. We prefer to scale up the culture and use liquid medium but nematodes could also be obtained from NGM plates. Approximately 30 mg clean embryo or adult nematode pellet is sufficient for each sample.
Collect embryos from asynchronous cultures by standard hypochlorite treatment (1 N NaOH, 30% bleach solution).
Wash embryos at least three times in S-medium.
Leave embryos to hatch overnight at 20°C in S-medium with 5 μg/ml cholesterol and 0.01% Tween-20 in the absence of bacteria.
Assay quality and quantity of hatched L1s.
Start three independent 50 ml S-medium cultures for each strain with approximately 35,000 L1 larvae. Cultures should contain Dam- E. coli (e.g., strain GM119 or SCS110) harvested from 100 ml bacterial culture as food source.
Grow cultures with continuous agitation (180 rpm) at 20°C.
Monitor cultures and harvest when they are enriched for the life stage to be analyzed (e.g., 53 h for non-gravid young adults; 66 h for accumulation of young embryos, etc.).
7.1. Harvest embryos by hypochlorite treatment and wash three times with M9.
7.2. Harvest adults by centrifugation and wash 5-7 times with M9 to remove bacteria.
Make aliquots containing ∼30 μl embryo or adult material. Remove excess liquid and snap-freeze in liquid nitrogen before storage at -80°C until further processing.
In our experience, the frequency of Dam methylation is significantly lower in embryos compared to adults (C. González-Aguilera and P. Askjaer, unpublished). We speculate that this is due to the rapid cell divisions in the early embryos, which continuously erase the Dam mark. (DNA replication converts the Dam mark into two hemi-methylated sequences, which are cut much less efficiently by DpnI). Potentially, the hsp-16.41 promoter may also have a higher basal activity in adults versus embryos. This difference in methylation frequency implies that the protocol differs slightly depending on the life stage to be analyzed.
1.Purify genomic DNA (gDNA) from ∼30 mg embryos or adults, e.g., with Qiagen DNeasy kit including RNase A (cat. #69504 and #19101). Avoid using too much material, as this will reduce the quality of the DNA prep.
2.Digest 2.5 μg of adult gDNA with 10 units DpnI (New England Biolabs® Inc., cat. #R0176S; cuts GmATC) in 10 μl overnight at 37°C in a thermocycler. Scale up the reaction 2-fold for embryonic gDNA. Include an additional reaction with DpnI for one of the biological samples to be used as ligation control (control A) and a control reaction without DpnI (control B).
3.Inactivate DpnI by incubation for 20 min at 80°C.
Steps 4-13 are relevant for identification of methylation sites by DNA arrays. For high-throughput sequencing, jump to step 14.
4.Prepare double-stranded adaptors by mixing 50 μl of primers AdRt (5’ CTAATACGACTCACTATAGGGCAGCGTGGTCGCGGCCGAGGA; 100 μM) and 50 μL of AdRb (5’ TCCTCGGCCG; 100 μM). Heat to 95°C and let cool down slowly to room temperature.
5.For embryos: Split DpnI digested DNA in two tubes, each with 10 μl.
6.Mix 10 μl DpnI digested DNA, 0.8 μl of the annealed adaptors (50 μM), 2 μl of 10x ligation buffer, and 5 units T4 DNA ligase (Roche Applied Science, cat. #10799009001, 5 U/μl), in a volume of 20 μl and incubate at 16°C in a thermocycler for 2 h or overnight. Include also a reaction with DpnI digested DNA but omitting the T4 DNA ligase (control A).
7.Inactivate the ligase by incubation for 10 min at 65°C.
8.Digest non-methylated GATC sites by incubating the ligation reactions with 10 units DpnII (New England Biolabs Inc., cat. #R0543S) in a volume of 50 μl for 1 h at 37°C. For embryos: Pool the two reactions in a single tube with 100 μl.
9.Amplify methylated DNA, using for instance Advantage® cDNA Polymerase Mix (Clontech Laboratories, Inc., cat. #639105). Perform also a control reaction without DNA template (control C).
1)28.75 μl ddH2O
2)5 μl 10x cDNA PCR reaction buffer (Clontech)
3)10 μl of DpnII digested DNA
4)1.25 μl of primer Adr-PCR (5’ GGTCGCGGCCGAGGATC; 50 μM)
5)4 μl dNTP mix (Takara Bio Inc., cat. #4030, each 2.5 mM)
6)1 μl Advantage cDNA Polymerase Mix
PCR parameters
|
|
Check 5 μl of PCR reaction on an agarose gel. Successful amplification of Dam-methylated DNA should produce a smear from 200 to 1500 bp. Appearance of discrete bands suggests the presence of a PCR contamination. If a strong smear appears in the control reactions A, B and C, try to reduce the number of cycles in step 12; control lanes do not necessarily need to be blank, but should be fainter than the other lanes.
To achieve sufficient material, 6-7 (embryos) or 2 (adults) PCR reactions from the same DpnII digestion are pooled and purified with Qiaquick PCR purification kit (Qiagen).
Quantify purified DNA. Typically, 1 μg of DNA is needed for labeling and hybridization, but additional quantities may be required for quality checks, depending on the genomics facility.
Label and hybridize to whole genome-tiling array according to the manufacture's instructions. Remember to include a dye-swap for one of the triplicates.
For high-throughput sequencing, a modified linker containing a recognition site for enzymes that cut DNA 20-25 bp after the recognition site are ligated to the DpnI-digested ends (e.g., EcoP15I or MmeI). Different strategies have been developed and the reader should consult the original papers (Luo et al., 2011; Sha et al., 2010). Please note that neither of the two papers identified DNA binding sites for C. elegans chromatin-associated proteins, hence, further optimization may be required.
Digest with EcoP15I or MmeI to generate short Dam tags.
Purify digested DNA. If the linker used in step 14 is biotin-labeled, purification can be performed with magnetic streptavidin beads.
Ligate second linker.
Optional: purify correctly ligated DNA based on size by denaturing polyacrylamide gel electrophoresis.
PCR amplify Dam fragments using linker-specific primers.
Gel-purify DNA of correct size (116-125 bp).
Submit fragments for Solexa sequencing.
ChIP or DamID followed by qPCR is a viable option when one knows or has a good guess as to where the protein binds. Real-time PCR is used to quantify the relative amount of ChIP DNA compared to input DNA at the test and control loci. Selecting the test region for qPCR depends on the target. For example, in the case of a DNA-binding transcription factor, one can choose primers encompassing a region of the promoter with a putative DNA sequence motif. Genome wide ChIP data is available for a number of transcription factors (http://www.modencode.org/). The negative control locus should be at a region with no expected binding. We recommend expressing ChIP enrichment as percentage of the Input. Some researchers use fold enrichment compared to IgG control, or the negative control loci. In this case, one needs to make sure that the background signal does not vary too much from experiment to experiment.
For identification and quantification of DNA fragments by array technology, samples from the Dam fusion strain and the “Dam only” control strain are processed in parallel and fluorescently labeled with different dyes, followed by co-hybridization on high-density arrays. Similarly for ChIP-chip, ChIP and input DNA are amplified and labeled by two different fluorescent dyes (Cy3 and Cy5) and co-hybridized to microarrays that encompass the whole genome (Buck and Lieb, 2004; Ercan et al., 2007). To avoid potential bias introduced by the two dyes, a dye-swap experiment should be performed with at least one of the biological replicates. Analysis of hybridization data, including normalization and smoothening can be performed with various algorithms. Briefly, fluorescence signal ratio of ChIP to Input or “Dam fusion” to “Dam only” is a measure of ChIP or DamID enrichment per probe, and due to normalization, enrichment at each locus is relative to the rest of the genome. Further processing of data will typically depend on the class of chromatin-association being investigated. Whole-Genome Tiling Arrays from Roche NimbleGen containing 2.1 million 50 nt probes have been used in both ChIP-chip and DamID experiments, but are no longer produced. Equivalent arrays from other manufactures have not been tested in C. elegans DamID, but have been employed in DamID experiments in other organisms as well as in C. elegans ChIP studies.
DamID and ChIP DNA can be directly sequenced by high-throughput sequencing. ChIP-seq provides higher resolution and greater dynamic range compared to ChIP-chip, and is currently cheaper since sequencing can be multiplexed, and commercial microarrays are being phased out (Park, 2009; Landt et al., 2012). Multiplexing is done by including a unique identifying index to each sequencing library and pooling libraries for sequencing, for example, in one lane of an Illumina® flowcell. For ChIP-seq, having greater numbers of short reads is more important than having long reads. Therefore, single-end sequencing of 36-50 bp by Illumina is a popular method of choice. Transcription factors with more focused binding and fewer binding sites typically require fewer reads, while targets with broad patterns, such as histone modifications, require more reads. In our experience, 10-20 million mapped 50 bp reads are usually enough for a large range of targets in C. elegans (Kranz et al. 2013). Typically 80-90% of reads from ChIP map to the genome. One lane of Illumina HiSeq2500 typically provides ∼150 million mapped reads, thus one can multiplex ∼8 samples in a lane. ChIP-seq enrichment score is calculated for each base pair across the genome as read coverage of ChIP compared to Input, and thus reflects relative binding with respect to the whole genome. To accurately determine protein-binding sites by peak calling, it is important to sequence matching Input DNA preferably at same or higher coverage (Chen et al., 2012).
Although most published DamID experiments used DNA microarrays, recent studies have mapped Dam methylation sites with Illumina sequencing (Sha et al., 2010; Luo et al., 2011). These two studies differ in several details, but both included an enzymatic trimming of the methylated fragments to provide 20-27 bp DamID sequence tags that were identified by massive sequencing. Approximately 38% of raw sequence reads could be mapped to unique GATC sites in the C. elegans genome (Sha et al., 2010), which implies that 10-20 million reads will be appropriate for each sample, thus similar to the situation in ChIP-seq.
Because data analysis will depend very much on several parameters, such as type of protein being analyzed (transcription factor, histone, nuclear envelope protein, and etc.), methods for data generation (array or sequencing), and extent of bioinformatics assistance available, it is not realistic to give detailed protocols on this aspect here. Please refer to published studies or contact us for further discussion.
The modENCODE consortium as well as the vast majority of published ChIP and DamID studies use either entire worms or developing embryos. The starting material is therefore a mixture of cell types and/or developmental stages, which hinders cell-type specific nuclear organization studies. One way to overcome this limitation is to make use of the C. elegans fixed lineage to carry out imaging-based analysis. Such techniques are low throughput compared to microarray- or sequencing-based studies, and only a limited number of loci/sequences can be studied. Imaging and ChIP/DamID are therefore complementary techniques. Fluorescence in situ hybridization is difficult to achieve in C. elegans, in particular in differentiated larvae or adults.
All techniques to tag a locus in vivo in its chromatin context rely on the recognition of a bacterial- or phage-binding site by its cognate repressor. A number of repressor/binding site couples have been used in a variety of organisms (lacI/lacO; tetR/tetO; λ repressor/operators). In C. elegans, the only system used up to now is the lacO/lacI couple (Carmi et al., 1998; Kaltenbach et al., 2000; Gonzalez-Serricchio and Sternberg, 2006; Yuzyuk et al., 2009; Meister et al., 2010b; Yuen et al., 2011; Towbin et al., 2012; Cochella and Hobert, 2012; Rohner et al., 2013). The system has been used to answer a variety of biological questions:
- analyze in vivo the interaction of a given protein (e.g., a transcription factor) with its cognate binding site, in a cell-type and developmental stage specific manner (Carmi et al., 1998; Kaltenbach et al., 2000; Updike and Mango, 2006; Kiefer et al., 2007; Yuzyuk et al., 2009).
- functionally dissect promoters for transcription factor binding and/or subnuclear positioning (Rohner et al., 2013; Updike and Mango, 2006; Yuzyuk et al., 2009).
- analyze mosaic worms using lacO/lacI as a tool to identify cells carrying an array (Gonzalez-Serricchio and Sternberg, 2006).
- determine cell ploidy by counting the number of lacO/lacI spots for a chromosomally integrated array (Gonzalez-Serricchio and Sternberg, 2006).
- quantify genome compaction using complex arrays in which binding sites are interspersed with exogenous DNA (Yuzyuk et al., 2009).
- analyze de novo centromere formation (Yuen et al., 2011).
- highlight changes in the organization of the nucleus during development (Meister et al., 2010b).
- uncover sequences and signals involved in genome nuclear organization (Meister et al., 2010b; Rohner et al., 2013; Towbin et al., 2012)
Depending on the biological question, the individual setup of the system is quite different. Here we present first a review of the different published systems, and then recently developed methods and reagents. In the last part, we discuss image acquisition and analysis techniques.
Two major systems have been used to visualize sequences in vivo using lacI/lacO. In the first system, hereafter described as “cis tagging”, a single transgenic array encodes fluorescently tagged lacI and carries lacO sites as well as the sequences of interest. Fluorescent lacI therefore binds to the array which encodes it. In the second type, “trans tagging”, two different transgenes are used. One transgene provides expression of fluorescent lacI but does not contain lacO sites, hence is not bound by fluorescent lacI and remains microscopically invisible. A second transgene carrying lacO sites as well as the sequences of interest is observed in this case. Both systems require the expression of fluorescently tagged lacI.
The Lac repressor from the E. coli lac operon is expressed as a fusion with a green or cyan fluorescent protein (GFP, CFP), and targeted to the nucleus by an NLS. There are a number of lacI variants currently used for tagging, and these variants differ between organisms for historical reasons. The most widely used in C. elegans is lacIq, a lacI version mutated in its C-terminal tetramerization domain that provides high affinity to the lacO repeats. In budding yeast, binding of lacI to lacO repeats was shown to lead to replication fork passage problems, which in turn can modify gene localization (Dubarry et al., 2011). This can be avoided by using lower affinity versions of lacI (lacI**, Dubarry et al., 2011). In C. elegans, no difference in gene positioning has been observed between lacIq and lower affinity lacI versions with respect to lacO repeats for larger arrays and for bombardment-mediated transgenes (P. Meister, unpublished observations). Expression levels of the GFP-lacI need to be low, as overexpression elevates background fluorescence, enhances non-specific binding, and can cause slow growth or sick animals.
Cis systems are obtained by microinjection and typically stay extrachromosomal. They are created new for each sequence to be tested. For the expression of lacI, different promoters active in all cells have been used (Table 1), either inducible (hsp-16.2p, Carmi et al., 1998; Gonzalez-Serricchio and Sternberg, 2006) or constitutively expressed (dpy-30p, his-24p, htz-1p, baf-1p, Carmi et al., 1998; Kiefer et al., 2007; Yuzyuk et al., 2009; Fakhouri et al., 2010; Meister et al., 2010b). As for other injected arrays, different levels of complexity can be achieved by adjusting the composition of injected DNA. Simple arrays, composed exclusively of plasmids are highly repetitive and contain up to 300 copies of each of the plasmids used to create them (Meister et al., 2010b). In this case, the single lacO site present in each plasmid is sufficient to form of a visible spot, as the total number of plasmids is high. Complexity of the array can be increased by adding, for instance, sonicated fish (salmon or herring) DNA (from 40 to 90% of the total DNA), but in this case a plasmid with lacO repeats has to be added to the injection mix (Kiefer et al., 2007; Yuzyuk et al., 2009; Fakhouri et al., 2010).
Table 1. Cis tagging systems—lacI expressing constructs and lacO sites present on the same transgene.
| Laboratory and Reference | Biological question | Array composition (misture of plasmids | lacI expression system/lacO composition* |
|---|---|---|---|
|
TY |
In vivo binding of SEX-1 to xol-1 promoter | 256x lacO/lacI/dpy-20 marker + or – promoter | hsp-16.2p::gfp-lacI (induced) |
|
PS |
Array tracking, mosaic analysis | 256x lacO/lacI/pBluescriptII carrier/dpy-20 or rol-6 marker | hsp-16.2p::gfp-lacI (induced) |
|
SM |
In vivo binding of PHA-4 to lin-26 promoter | 256x lacO/lacI/cha-1 marker/promoter/ pha-4p::yfp plus herring DNA | htz-1p::lacI-cfp |
|
SM |
Chromatin compaction and cell plasticity | 256x lacO/lacI/cha-1 marker/promoter/ pha-4p::yfp plus herring DNA | htz-1p::lacI-cfp |
| 256x lacO/lacI/cha-1 marker/promoter/ pha-4p::yfp plus herring or salmon DNA | his-24p::lacI-cfp | ||
|
SM |
Transcription factors cell type specificity and function in chromatin decompaction | 256x lacO/lacI/cha-1 marker/promoter/ pha-4p::yfp plus herring DNA | his-24p or htz-1p::lacI-cfp |
| 256x lacO/lacI/cha-1 marker/promoter/ pha-4p::yfp plus herring DNA | htz-1p::mCherry-lacI | ||
|
GW§ |
Nuclear organization changes during development | 1x lacO/lacI/myo-3::rfp marker | baf-1p::gfp-lacI** |
|
Transgene type: except where indicated transgenes are extrachromosomal injected arrays. §Transgene is an integrated injected array. lacI expression system: coinjected with and on the same array as the lacO sites. lacO composition: 256x lacO repeats coinjected except where indicated. **1x lacO on each plasmid. |
|||
The main advantage of cis systems is their ease of creation: they only require injection of a single DNA mixture, a standard technique in C. elegans laboratories. In these systems, the array carries four different components: (1) an expression construct for a fluorescently labelled protein of interest, (2) its putative binding sequence, (3) lacO repeats, and (4) the lacI-expressing plasmid. Colocalization on the array of fluorescent lacI and the fluorescent protein of interest (in different colors) indicates binding of the protein of interest to the sequence. SEX-1 binding to the xol-1 promoter and a number of rules for PHA-4 binding to its target promoters were characterized with this technique (Carmi et al., 1998; Kiefer et al., 2007; Fakhouri et al., 2010). Using complex arrays, the role of H3K27-dependent chromatin compaction during development was uncovered, which would not have been visible with smaller transgenes (Yuzyuk et al., 2009; Fakhouri et al., 2010).
Extrachromosomal arrays are randomly lost during cell division. This has the unique advantage to allow cell-autonomous gene-function analysis, or “mosaic analysis”. The lacO/lacI spot can be used to identify unequivocally cells carrying the array (which becomes visible) (Gonzalez-Serricchio and Sternberg, 2006).
The main disadvantage of injected arrays is that it is difficult to control for their size and the exact ratio of their individual components, especially when adding fish DNA. A posteriori determination of array composition requires genomic DNA purification and quantitative PCR on the different components. Furthermore, it is almost impossible to determine the exact composition of complex arrays as the total size of the array is impossible to determine precisely.
A number of transcriptional cis effects have been observed in arrays: in a strain carrying a GFP-lacI-expressing array with a myo-3 muscle-specific marker, lacI is more expressed in muscle cells, while with a vit-5 gut marker, the same lacI construct is more expressed in gut cells (Meister et al., 2010b). To avoid such cis effects, one can separate the transgenes encoding lacI and marker genes from the sequences of interest tagged with lacO: trans tagging. Moreover, the latter systems are easy to use as strains can be injected and/or crossed (Meister et al., 2010b; Cochella and Hobert, 2012; Towbin et al., 2012; Rohner et al., 2013 ).
All published systems are described in Table 2A and B. Importantly, when creating new fluorescent lacI expression arrays for trans tagging, the plasmids used must not contain lacO sites (5’-TTGTTATCCGCTCACAA), even as a single copy. Otherwise lacI will bind these and lead to the formation of a spot (cis tagging Gonzalez-Serricchio and Sternberg, 2006; Meister et al., 2010b).
Table 2A. Trans tagging systems—lacI expressing constructs and lacO sites present on different transgenes*
| # | lacI expression | lacI transgene type* | lacI array composition (mixture of plasmids) | lacI expression system | lacO target array composition | lacO trangene type* | lacO composition |
|---|---|---|---|---|---|---|---|
| 1 | syIs46 | Ext. | lacI/dpy-20+ | dpy-30p::gfp-lacI + hsp16.2p::gfp-lacI (induced) | 256x lacO/promoter/rol-6+ plus salmon DNA | Ext. | 256x lacO repeats coinjected |
| 2 | syIs46 | Int. | lacI/BluescriptII carrier plus herring DNA | dpy-30p::gfp-lacI + hsp16.2p::gfp-lacI (induced) | 256x lacO/ | Ext. | 256x lacO repeats coinjected |
| 3 | pxEx214 | Ext. | lacI/rol-6+ | htz-1p::lacI-cfp | 256x lacO/promoter/cha-1+ plus herring DNA | Ext. | 256x lacO repeats coinjected |
| 4 | gwIs39 | Int. | lacI/vit-5::gfp | baf-1p::gfp-lacI | rol-6+/hsp-16.2::hlh-1 or pha-4 | Int. | 1x lacO on each plasmid |
| 5 | gwIs39 | Int. | lacI/vit-5::gfp | baf-1p::gfp-lacI | 256x lacO/promoter::mCherry/unc-119+ | Bom. | 256x lacO repeats co-bombarded |
| 6 | mels1 | Bom. | lacI/unc-119+ | pie-1::gfp-lacI | 64x lacO/rol-6+ | Ext. | 64x lacO repeats coinjected |
| 7 | gwIs39 | Int. | lacI/vit-5::gfp | baf-1p::gfp-lacI | MosSCI with 256x lacO/unc-119+ | MosSCI | 256x lacO repeats integrated by MosSCI |
| 8 | gwIs39 | Int. | lacI/vit-5::gfp | baf-1p::gfp-lacI | 256x lacO/Isy-6 sequence/elt-2::dsred | Int. | 256x lacO repeats coinjected |
| 9 | gwIs39 | Int. | lacI/vit-5::gfp | baf-1p::gfp-lacI | hsp-16.2::gfp | Int. | 1x lacO on each plasmid |
| 10 | gwIs39 | Int. | lacI/vit-5::gfp | baf-1p::gfp-lacI | 256x lacO/promoter::mCherry/unc-119+ | Bom. | 256x lacO repeats co-bombarded |
| 11 | gwIs39 | Int. | lacI/vit-5::gfp | baf-1p::gfp-lacI | MosSCI with 256x lacO/unc-119+ | MosSCI | 256x lacO repeats integrated by MosSCI |
| *Transgene type: Ext.—Extrachromosomal injected array, Int.—Integrated injected array; Bom.—Bombarded transgene; MosSCI—transgene integrated by MosSCI. | |||||||
Table 2B. Sources for Trans tagging systems
| # | Laboratory | Biological question | Reference |
|---|---|---|---|
| 1 | SM | In vivo binding of PHA-4 to lin-26 promoter | Kaltenbach et al., 2000 |
| 2 | PS | Ploidy analysis | Gonzalez-Serrichio et al., 2006 |
| 3 | SM | In vivo binding of HTZ-1 and transcriptional activation of pharyngeal genes | Updike and Mango, 2006 |
| 4 and 5 | GW | Nuclear organization changes during development | Meister et al., 2010b |
| 6 | OD | De novo centromere formation | Yuen et al., 2011 |
| 7 | GW | Signals for perinuclear heterochromatin anchoring | Towbin et al., 2012 |
| 8 | OH | Early asymmetric cell commitment and mRNA locus decompaction | Cochella and Hobert, 2012 |
| 9, 10, and 11 | GW | Nuclear organization and promoter dissection of heat-shock induced hsp-16.2 | Rohner et al., 2013 |
| #Corresponds to the # listed in Table 2A. | |||
Four different strains expressing fluorescent lacI have been published to date and can be used directly by crossing them to the desired lacO carrying strain. The first strain, PS2958, carries an integrated injected array (syIs46) in which two plasmids drive expression of GFP-lacI, by the heat-shock inducible hsp-16.2 promoter, and the constitutive dpy-30 promoter (Gonzalez-Serricchio and Sternberg, 2006). GFP-lacI is expressed from the 20-cell stage onward (likely from the dpy-30 promoter) and is still visible in some cells in adults. However, the plasmids used to create this array contain lacO sites, hence the array is microscopically visible as GFP-lacI binds to it. Two large structures can be observed in all cells in uninduced conditions (P. Meister, unpublished observations). This construct has been used for mosaic analysis and ploidy determination. The second strain carries an extrachromosomal complex array (SM1353 pxEx214) with a rol-6 marker and a CFP-lacI expression construct under the transcriptional control of the htz-1 promoter (Updike and Mango, 2006). The array also expresses the histone variant HTZ-1 tagged with YFP. The last two strains express GFP-lacI from integrated transgenes. In GW396, gwIs39, an injected integrated array, drives expression of GFP-lacI under transcriptional control of the constitutive baf-1 promoter (Meister et al., 2010b). In this strain, expression is silenced in the germline and GFP-lacI is visible from about the 20-cell stage to late L4 (this array has a vit-5::gfp intestinal marker expressed from late L4/adulthood, which hinders GFP-lacI observation at those stages). Last, the AV696 strain carries a bombarded construct (meIs1), in which GFP-lacI is transcriptionally regulated by a pie-1 promoter (Yuen et al., 2011). Here, the fluorescent signal decreases rapidly at the beginning of embryogenesis, but is expressed in the germline, thus is useful to locate chromatin loci in the germline or in early embryos. Making a strain carrying both meIs1 and gwIs39 leads to silencing in trans of the pie-1 construct in the germline (P. Meister, unpublished observations; Robert et al., 2005).
Choice of the fluorescent lacI expression strain should therefore depend mainly on the developmental stage of the biological question, either germline/early embryos (AV696) or late embryos/larvae/adults (GW396/PS2598/SM1353).
The transgene carrying lacO sites is what will be visualized. Different sizes of lacO transgenes have been analysed, ranging in size from large injected arrays to single copy integrations. Similar to cis tagging, simple arrays are readily identifiable with one lacO site per plasmid used to create them (Gonzalez-Serricchio and Sternberg, 2006: Meister et al., 2010b). Complex arrays need additional lacO repeats to lead to the formation of a visible spot (Updike and Mango, 2006). Most of the published C. elegans simple arrays have been created with plasmids containing a single lacO site (e.g., most of the Fire library plasmids contain a single lacO). These are readily detected, usually at the nuclear periphery linked to their heterochromatic features and transcriptional silencing (Meister et al., 2010b; Towbin et al., 2010).
Smaller transgenes with germline expression can be created by bombardment. In this case, 10-50 copies of the bombarded plasmid are typically integrated, with some variability in the number of the individual co-bombarded plasmids (Meister et al., 2010b; Rohner et al., 2013). A single lacO site per plasmid is no longer sufficient for the formation of a spot (compared to the 200-500 lacOs present in an injected simple array—in budding yeast about 24 repeats is the minimal repeat length that can be visualized, yet this depends on the unbound lacI fluorescent background). Hence, lacO repeats must be co-bombarded with the plasmids of interest (e.g., 256 repeat, pSR1) (Rohner et al., 2008; Meister et al., 2010b). This method leads to about 50% co-integration rate, with visible transgenes when GFP-lacI is expressed in trans. These low-copy transgenes are less subject to silencing and display usually a random localization in embryos (Meister et al., 2010b; Towbin et al., 2010; Rohner et al., 2013).
Single targeted genomic insertions of lacO arrays can be achieved using MosSCI and derivatives (Frokjaer-Jensen et al., 2008; Towbin et al., 2012; Rohner et al., 2013). Unlike insertion at random loci, this method allows the insertion of different sequences next to the lacO array at the same genomic location. This equalizes potential integration site and copy number effects, which are impossible to control for when using microparticle bombardment or injected arrays. As this method is new, two variations are detailed below. Finally, a number of strains carrying a single copy insertion of lacO repeats have been created by randomly inserting a modified Mos transposon (Christian Frøkjær-Jensen, personal communication).
For all single site insertions, 256 lacO repeats (about ∼12 kb in size) are used for a sufficient signal to noise ratio of the lacI fluorescence. One needs to be cautious when using plasmids containing lacO repeats since such vectors (pSV2-dhfr-8.32, pSR1, Robinett et al., 1996; Rohner et al., 2008) are direct repeats and can recombine during amplification in bacteria. Therefore recA bacterial strains (DH5α/XL1 blue) or recB recJ (SURE) are recommended for amplification/cloning. Moreover, when defreezing bacterial strains transformed with lacO repeat plasmids, it is good practice to isolate about 8 single colonies and test the length of lacO repeats by restriction enzyme digestion as the repeat stretch has a tendency to shrink in size. In addition, after insertion into the C. elegans genome the actual number of sites that is integrated is likely to be lower.
For simple arrays, the single lacO site present in the plasmid is sufficient for the formation of a visible spot due to the high plasmid copy number. Injection is carried out as for normal arrays, with concentrations of the fluorescent lacI construct ranging from 2.5–50 ng/μl (see WormBook chapter Transformation and microinjection).
Typical concentrations are as follows:
- selectable marker (e.g., myo-3::rfp construct) 10-50 ng/μl
- fluorescent lacI expression construct 2.5-50 ng/μl
- sequences of interest variable (length dependent)
For complex arrays, additional lacO sites should be added to the injection mixture.
Typical concentrations are as follows:
- selectable marker (e.g., cha-1 rescuing construct) 2 ng/μl
- lacO repeat fragment (e.g., pSV-dhfr-8.32 SphI/KpnI) 4.5 ng/μl
- fluorescent lacI expression construct 2.5-50 ng/μl
- sequences of interest variable (length dependent)
- sheared salmon/herring sperm DNA/E. coli DNA to 100 ng/μl
Injection is carried out as described (see Transformation and microinjection).
These arrays are similar to those for cis tagging, except that the fluorescent lacI expression construct is omitted and the injected strain expresses a fluorescent lacI (see above). In case addition of metazoan DNA to the complex array is a concern, replacing sheared fish DNA with sheared E. coli DNA has been used successfully (Cochella and Hobert, 2012).
As for complex arrays, the unique lacO site in the plasmids used for bombardment is not sufficient for the formation of a visible spot. Hence, a lacO repeats-containing fragment is co-bombarded with the sequences of interest and a selectable marker. Typically, unc-119(ed3) nematodes are bombarded with 8 μg of a 1:1:1 (w/w) mixture of an unc-119 rescuing construct, the sequences of interest and lacO repeats (e.g., pSR1 Rohner et al., 2008).
lacO constructs exist for ectopic integration of sequences at the ttTi5605 chromosome II MosSCI locus (Rohner et al., 2013). These plasmids can be modified by restriction enzyme cloning to insert sequences of interest next to the lacO arrays. The resulting plasmid is used as a template to integrate lacO repeats at the ttTi5605 site. MosSCI is carried out according to the original protocol (Frokjaer-Jensen et al., 2008; Frokjaer-Jensen et al., 2012). Integration of certain constructs, especially longer ones, is more difficult to achieve for unclear reasons, in which case the indirect MosSCI heat-shock procedure is recommended.
To tag other loci with lacO repeats (e.g., close to your favorite gene/sequence), similar Mos-mediated integration can be carried out using a Mos insertion located near the site of interest. Due to the resolution of optical microscopes, ‘near’ means in the next 20-40 kb (Meister et al., 2010a). In some cases, increasing the distance between the Mos insertion and the region of interest might even be recommended to avoid possible artifacts due to the integration of lacO repeats. Although no such case has been described in the nematode, it is a good control to compare localization obtained with lacO integrations with fluorescence in situ hybridization of the same locus in a wild-type strain. Approximately 13,000 Mos insertions have been created by the NemaGeneTag project, and are available to the community as unvalidated or validated insertions (http://elegans.imbb.forth.gr/nemagenetag/). All insertions can be browsed (http://pbil.univ-lyon1.fr/segalat/data/index.php) and ordered (http://ums3421.univ-lyon1.fr/spip.php?article14) online. This is the most cost-effective manner to create lacO-tagged loci, as compared to ZFN/TALEN methods (Transcription-Activator Like Effector Nuclease) (Wood et al., 2011), in which the nuclease is engineered to create a double strand break at a given sequence, providing a break for homologous recombination. CRISPR-based techniques are likely to be similarly efficient to Mos excision for the creation of the site-specific DSB (Dickinson et al., 2013). To achieve site-specific recombination, MosSCI requires homology between the Mos insertion site where the break is created by transposon excision and the plasmid, which serves as a template for homologous recombination during break repair. To efficiently achieve the creation of templates with homology surrounding lacO repeats, a triple plasmid Gateway® (Invitrogen) system with a middle lacO/Cb unc-119 plasmid has been created (Towbin et al., 2012).
|
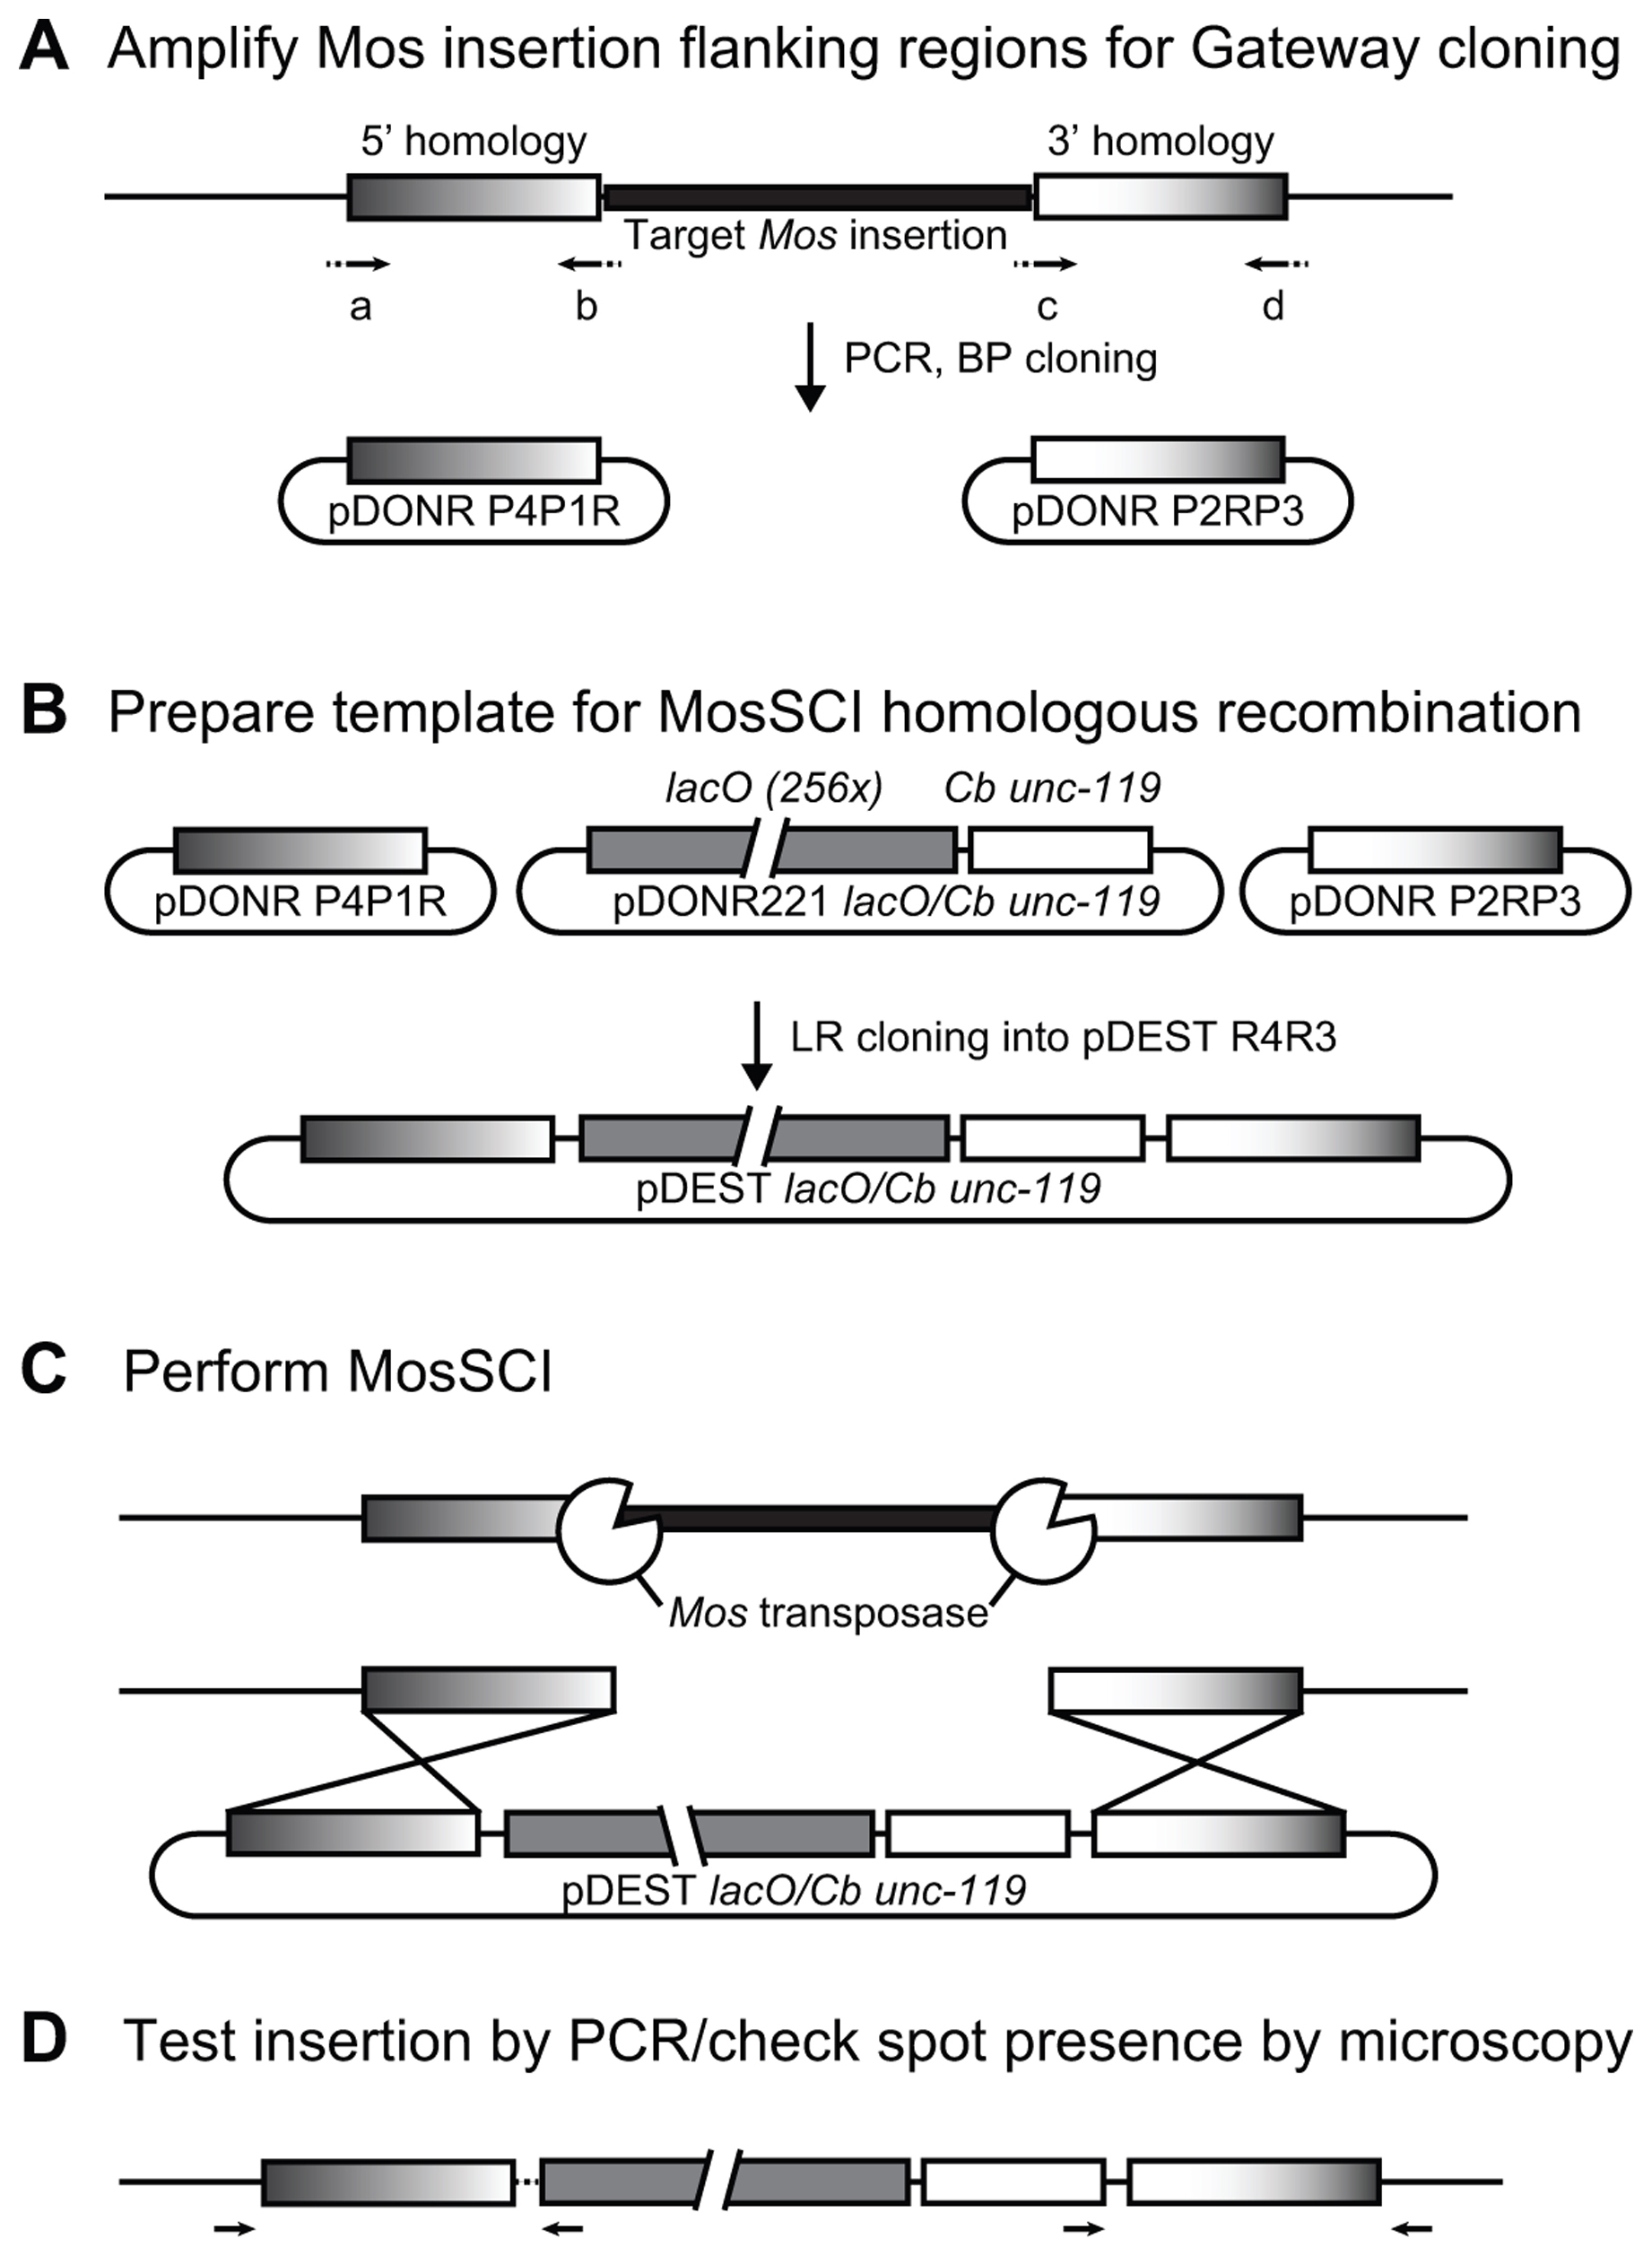
Figure 3. Method for insertion of lacO repeats at a given Mos insertion site. A. Regions flanking the Mos insertions are amplified by PCR using primers a, b, c, and d with Gateway-specific overhangs (dotted, see sequence in the text). Amplified homology stretch is recombined in the Gateway 5’ and 3’ vectors using BP. B. The template for recombination is created by LR recombination of the vectors created in A. with the middle lacO/Cb unc-119 . C. Mos-mediated Single Copy Integration is carried out in the strain carrying the Mos insertion of interest in an unc-119(ed3) background, which leads to the integration of the lacO/Cb unc-119 template at the Mos locus. D. Insertion is tested by PCR using primers located in the lacO/Cb unc-119 insertion and outside of the homology stretch.
Cross the Mos insertion strain to an unc-119(ed3) mutant and select for Unc worms homozygous for the Mos insertion of interest (selection by PCR). At this point, it is good to cross in the transgene for the expression of GFP-lacI to have a visual confirmation of lacO integration later (see above for strains).
Design primers to amplify left and right sequences located at the 5’ and 3’ of the Mos insertion site (Figure 3A). 1.5 kb is sufficient for efficient recombination (Robert and Bessereau, ). Primers are designed for Gateway BP cloning.
Use following 5’ extensions for the following primers a to d (in 5’-> 3’ direction):
a: GGGG ACA ACT TTG TAT AGA AAA GTT G—locus specific sequence
b: GGGG AC TGC TTT TTT GTA CAA ACT TG—locus specific sequence (reverse complement)
c: GGGG ACA GCT TTC TTG TAC AAA GTG G—locus specific sequence
d: GGGG AC AAC TTT GTA TAA TAA AGT TG—locus specific sequence (reverse complement).
To minimize amplification errors, we use Phusion® polymerase (New England Biolabs, Inc.) according to the manufacturer's instruction with the following cycling conditions: [98°C, 30’’]; [98°C, 10’’; 45°C, 30’’; 72°C 30’’/kb] 5x; [98°C, 10’’; 50°C, 30’’; 72°C, 30’’/kb] 20x; 72°C, 10’ 12°C ∞.
Test amplicon length and perform BP cloning according to the manufacturer's manual (Invitrogen). In our hands, it is preferable to transform and plate at least half of the cloning reaction to get a sufficient number of colonies. BP cloning has been highly efficient, with at least 7 out of 8 colonies testing positive for the desired insertion.
Perform the Gateway LR reaction with the 5’, middle [see note above about lacO repeats plasmid], and 3’ clones. Transform at least half of the LR reaction to get a sufficient number of colonies. Test the plasmids using a PCR across 2 elements of the recombination reaction and prepare minipreps.
Test the length of lacO sites in the destination vector. The length of the repeats should be about 10 kb to make a visible spot in vivo. Normally the lacO repeats length does not change drastically during LR recombination, as LR uses a site-specific recombinase and transformation is carried in DH5α recA strains. It is recommended however to purify plasmids from 8-10 different colonies.
Carry on MosSCI according to the original protocol (Frokjaer-Jensen et al., 2008; Frokjaer-Jensen et al., 2012). Use the indirect, heat-shock procedure if the direct insertion is not successful.
Check insertion by PCR using primers outside of the homology region and in the inserted transgene. Check for the presence of a visible spot under the microscope in 2-3 lines. During the homologous recombination procedure, some lacO repeats might get lost, which therefore makes the GFP-lacI spot difficult or impossible to see. However, most of the lines we obtained had a readily visible spot.
Independent of the tagging system used, once lines expressing a fluorescent lacI and carrying lacO-tagged constructs have been obtained, there are two ways of imaging the lacI/lacO spots. The animals are either fixed and stained or directly imaged on an agarose pad. As procedures for fixing, staining and imaging are similar to published protocols (see WormBook chapter Immunohistochemistry; Kiefer et al., 2007, see also DamID Section 3.3.2.1 above), we will focus on live imaging of nematode embryos and larvae.
|
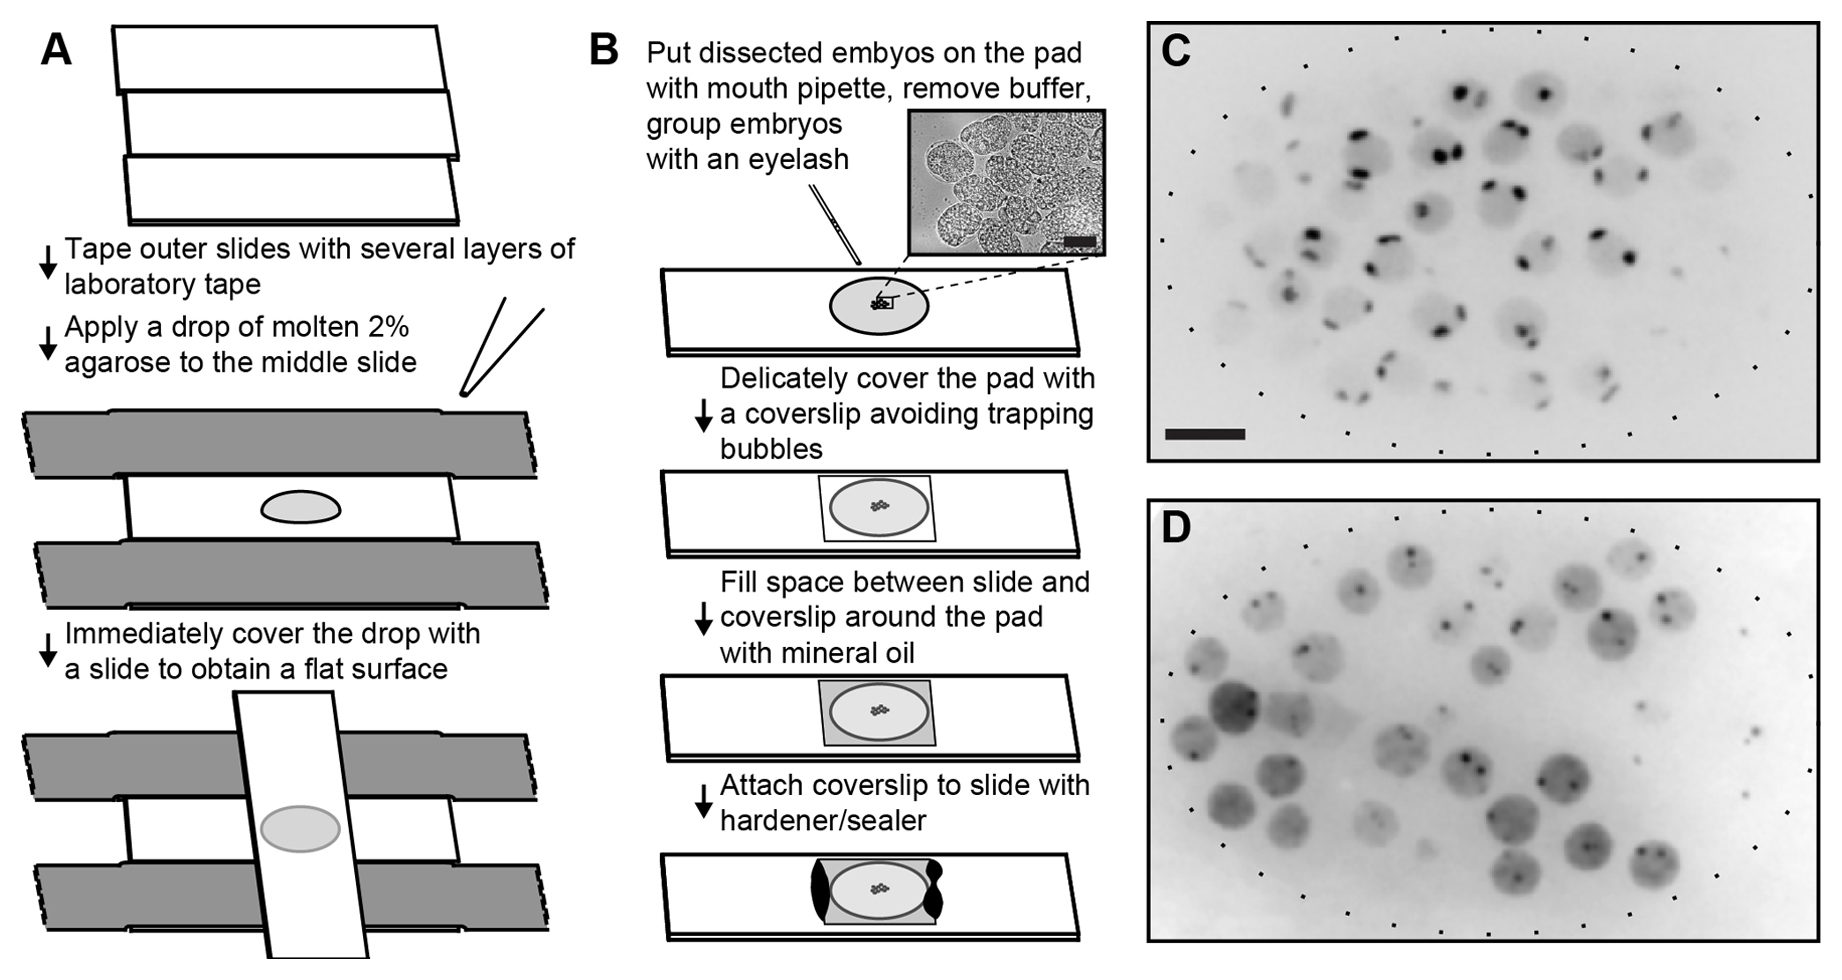
Figure 4. Imaging live embryos carrying lacO inserts. A. Preparation of the agarose pad, using 3 microscope slides. The outer two slides are taped to the bench using thick laboratory tape. Additional layers of tape will determine the thickness of the agarose pad. A drop of molten 2% agarose is placed in the center of the middle slide and immediately covered with a perpendicular slide, creating a flat pad. B. Embryos dissected in an watch glass are transferred to the agarose pad using a mouth pipette. Excess buffer is removed with the pipette and embryos are grouped with an eyelash (bar = 20 µm). After covering the embryos with a coverslip, the space around the pad is filled with injection oil and the coverslip is sealed to the slide using Vaseline/lanoline/paraffin or Vaseline alone. C. Axial z projection of a stack of optical slices of an embryo expressing GFP-lacI from an integrated large array with lacO (GW76, gwIs4[baf-1::GFP-lacI; myo-3::RFP]X). Two large spots corresponding to the homolog chromosomes are visible in each nucleus (bar = 5 µm). D. Axial z projection of a stack of optical slices of an embryo expressing GFP-lacI from an integrated large array without lacO and an insertion of lacO repeats created using the technique described in Figure 1 (GW440, gwIs39[baf-1::GFP-lacI; vit-5::GFP]III gwSi0[lacO/Cb unc-119@ttTi5605]II). The GFP-lacI expressing array is not visible as it carries no lacO sites. The single copy insertion forms small spots, although these are highly dynamic and appear larger on a z-projection.
Prepare the molding bench (Figure 4A).
Put three microscope slides next to each other on a flat surface. Stick both outer slides with tape to the surface, putting thick laboratory tape on top of the slides. The thickness of the pad will depend on the thickness of the tape glued on the outer slides. Put 2-3 additional layers of tape on the slides to increase the thickness of the pad.
Prepare 2% agarose in water and melt at 95°C. Agarose can be aliquoted in 0.5-1 ml tubes for future use and stored at room temperature. Re-melting of aliquoted agarose is achieved by putting the solution at 95°C for 5 min followed by brief vortexing. The molten agarose can be kept longer at 70°C instead of 95°C. At high temperatures, agarose hydrolyzes and does not harden anymore.
Prepare the agarose pad (Figure 4A). Put a drop (50-100 μl) of molten agarose on a slide placed in the middle of the two taped slides. Immediately place a second slide, perpendicularly to the first one, creating a flat surface. This can be kept for several hours if the upper slide is not removed (otherwise the pad dries out and becomes unusable).
Pick gravid adults with fine forceps, move them to an watch glass filled with M9. In our hands, GFP fluorescence is always higher when worms have been grown at temperatures above 20°C. This is likely due to GFP variants optimized for mammalian expression at 37°C, as we also observed that fluorescence is higher after heat-shock at 34°C. Try to avoid taking too much bacteria as E. coli will stick to embryos once dissected and usually has high auto-fluorescence. If needed, move the adults with a platinum pick to bacteria-free plates prior putting them in M9 buffer.
Cut adults in the middle of the worm (approximately at the vulva). Delicately squeeze the head and tail parts to release the embryos from the adult carcasses.
Using a mouth pipette, aspirate the embryos. Mouth pipettes are made using glass capillaries: (1) A 10 μL micro-sampling glass pipette is heated in the flame of an ethanol burner; (2) Once the glass is soft, pull both ends apart; (3) Break the elongated ends to create a pipette with an end with a diameter of ∼40 μm; (4) Place the pipette in a mouth pipette aspirator (Sigma-Aldrich cat. #A5177 or building plans available upon request).
Transfer the embryos to the agarose pad. Make sure to hold the tip of the mouth pipette vertically during the transfer as failure to do so will lead to dripping of embryos out of the capillary. Once over the agarose pad, blow in the mouth pipette to expel the embryos, allow them to settle on the agarose (20 sec), delicately aspirate excess M9 with the mouth pipette. The M9 layer should be at a minimum height, so that embryos do not move anymore when an eyelash is put on the pad.
Group embryos together using an eyelash tip (a flexible eyelash fixed on a tip/toothpick with nail polish). Grouping embryos together is very helpful for finding the embryos under the microscope and minimizes the search time at high magnification.
Put a coverslip on top of the pad/embryos, making sure to avoid trapping too many bubbles, in particular close to the embryos as bubbles diffract light. The coverslip should be laid at an angle on one side of the pad and then slowly lowered on the embryos, pushing away bubbles.
For longer acquisition times, it is recommended to minimize evaporation (which would flatten the pad, damage embryos and shift focus). Injection oil (mineral oil, Sigma-Aldrich cat. #M5904) efficiently hinders water exchange between the pad and the exterior. Injection oil also allows oxygenations so that the embryos can develop and hatch if kept overnight in such a chamber. Put enough oil to fill the gap between the slide and the coverslip around the agarose pad.
In order to avoid movement of embryos due to focusing and sliding of the coverslip/pad, glue the coverslip to the slide using either a 1:1:1 mixture of Vaseline/lanoline/paraffin (also known as Valap) (on 2 sides only to avoid impairing gas exchanges) or Vaseline (less solid). Both types of glue melt at 70°C.
Preparation of agarose pads is similar to the preparation of pads for embryos, except that 0.5 μl 10% NaN3 is added per 1 mL agarose. This inhibits movement, but also depletes ATP in the worms. This technique is hence not suited for long-term imaging. Alternatively, anesthetizing worms with 400 mM ethanol has been recently shown to deliver similar results (Alicia Woock and Jennifer Cecile, personal communication). Similarly, worms can be anesthetized with 1 mg/ml Tricaine (ethyl 3-aminobenzoate methanesulfonate salt) and 0.1 mg/ml of tetramisole hydrochloride dissolved in M9 before transferring them onto the agarose pad (Yuen et al., 2011).
When transferring worms to the agarose pad, care should be taken not to transfer too many bacteria as these are autofluorescent. Worms can be washed in M9, spun down and recovered with a pipette before depositing a drop of worm-containing M9 on the pad. Excess M9 is removed with a mouth pipette before putting a coverslip on top of the worms.
Imaging lacO-tagged chromatin in embryos is challenging: embryos are relatively thick (about 20 µm) and diffract light; the lacO/lacI spot can be small (sub-resolution) and highly dynamic; the fluorescent signal is low as overexpression of lacI is deleterious for the animals; and finally, C. elegans embryos and larvae are highly sensitive to focused light.
If the fluorescence signal of the lacO/lacI spot is bright (e.g., the transgene is large) and embryos/worms do not have to be imaged too frequently, a classical epifluorescence microscope equipped with a mercury lamp is sufficient for imaging (Carmi et al., 1998; Gonzalez-Serricchio and Sternberg, 2006; Cochella and Hobert, 2012). These systems are especially well suited when lineaging is necessary.
For most lacO constructs, however, confocal imaging is essential or optimal to answer the biological question. Indeed, the observed structure can be small (sub-resolution for single copy inserts) and out-of-focus haze would make it invisible. Two main systems are used to achieve confocal images: point scanning and spinning disk confocal microscopes. In the first system a focused laser beam is moving over the sample at high speed, and emitted light is filtered for out-of-focus photons by passing through a pinhole and acquired by a photomultiplier. These systems are well suited for imaging large arrays (Updike and Mango, 2006). They are however not adapted for repeated imaging as laser power hence light-induced damage is concentrated on a single point.
An alternative solution, which minimizes excitation/damage, is the use of spinning disk confocal devices. In spinning disk microscopy, the laser beam is split into hundreds of focused sub-beams, rotating on the sample at high speed. The laser power on each point as well as the time spent by the laser on each point of the sample (dwell time) is minimized, but repeated several hundred times per second. Emitted light is filtered through the pinholes, and photons are acquired using a highly sensitive CCD camera. Image acquisition speed is limited by the frame-reading rate of the camera: the whole field of view can be acquired in as little as 30 milliseconds (the minimal readout time of the camera chip). Using a correct combination of lenses/objective/camera, sampling will meet the Nyquist rate (about 90 nm/pixel). We found that the best system for this application is a spinning disk confocal microscope. To obtain stacks spanning the entire thickness of embryos, higher laser power has to be applied to be able to record light emitted from nuclei located far away (in the z direction) from the objective. Indeed, light from these nuclei is diffracted by the embryo structures located between the objective and them, which greatly reduces the signal. In our microscopy systems, this is usually incompatible with survival of the embryos when imaging repeatedly. For time-lapse experiments, imaging is limited to the 10 μm (in the z direction) closer to the objective, which give the best signal to noise ratio. Chromatin inside the nucleus is dynamic, hence precise positioning of the GFP-lacI/lacO spots necessitates a fast acquisition device. Typically, exposure time should not be more than 100 ms per optical slice. As for any live imaging, it is good practice to evaluate whether the development of the worms is disturbed by light exposure. An easy way to check this is to compare illuminated and control embryos at approximately the same stage and follow their development over time using DIC microscopy.
Typical images acquired with a spinning disk confocal (TILL Photonics) of embryos carrying two different types of lacO-tagged chromatin are shown in Figure 4C-D. Large arrays (about 300-500 copies of the injected plasmids, 3-5 Mb in size, strain GW76) obtained by gonadal injection, create large heterochromatic structures, which are located at the nuclear periphery due to their epigenetic silencing (Figure 4C and Towbin et al., 2012). In Figure 4D, an embryo with 256 lacO repeats integrated as a single copy using the MosSCI technique described above is shown (GW440, Rohner et al., 2013). In each nucleus, the GFP-lacI spot is smaller and emerges from background nuclear fluorescence created by unbound GFP-lacI. This system has been used to test the function of conserved sequences in the hsp-16.2 promoter on perinuclear pore localization, inserting different mutant versions of the promoter at the same locus.
Chromatin compaction state has been correlated with its transcriptional status as well as cell plasticity (Yuzyuk et al., 2009; Fakhouri et al., 2010; Cochella and Hobert, 2012; Rohner et al., 2013). Only large arrays are adapted to this type of measurement as for smaller transgenes de-compaction is either not visible (bombarded transgenes) or not relevant (single lacO insertions).
In the easiest case, arrays adopt different shapes over time or space. Quantification can therefore be achieved by classifying the shapes and counting the number of cells in which arrays have a specific shape. This has been used to show that complex arrays progressively increase their compaction state during development (Yuzyuk et al., 2009).
Alternatively, compaction measurement can be achieved on projections along the z-axis by calculating the ratio of the surface occupied by the array versus the projected nuclear surface (Cochella and Hobert, 2012). Similarly, the 3D volume of a transcriptionally-activated array can be normalized to the volume of a non-transcriptionally-activated array (Rohner et al., 2008 ). Finally, ad hoc solutions can be developed using image analysis software [Volocity (PerkinElmer) or Imaris (Bitplane)] to measure array volume in different cell types or following a given treatment (Rohner et al., 2008 ; Fakhouri et al., 2010).
Location of a tagged locus inside the nuclear volume is most easily determined by measuring the position of the locus relative to the nuclear periphery (radial position). The nuclear periphery can be outlined either by labeling a component of the nuclear lamina or the nuclear pore complex, or using the background fluorescence of the unbound GFP-lacI. The first method is more precise as boundaries are sharper, but introducing this fluorescent peripheral marker in the lacO/GFP-lacI strain requires an additional worm-crossing step. A number of strains exist, with either tagged lamin (YG66, baf-1p::gfp::lmn-1, Mattout et al., 2011) or tagged lamin-associated proteins (XA3507, pie-1p::lem-2::gfp, Galy et al., 2003). Alternatively, staining with an anti-lamin or an anti-nuclear pore can also be used.
|
Figure 5. Radial scoring using the three zones methods. A. A z stack across the embryo is acquired using a confocal microscope. Typical projection along the z axis is shown for an embryo carrying a lacO-tagged locus bound by GFP-lacI (2 spots per nucleus) and expressing a nuclear periphery marked (GFP-LMN-1). B. Blow-up of a single nucleus from A. C. Determination of the xy plane in which the two copies of the tagged locus are located using maximal fluorescence intensity. Spots appear elongated due to the image acquisition system (point spread function). D. For each spot in the plane for which its brightness is maximal, measurements of the diameter of the nucleus (red line) and the shortest distance from the spot to the nuclear rim (black line). The section of the nucleus is binned into 3 zones of equal surface (1, 2 and 3). E. Binning of measurement into 3 zones for a number of loci/nuclei. The dark blue series are enriched at the nuclear periphery (zone 1) while the light blue series are enriched in the nuclear interior (zones 2 and 3, red dotted line: random distribution, figure adapted from Meister et al., 2010b). F. Comparison of the ideal measurement (shell method) and the zone scoring. The excluded volumes are highlighted (figure adapted from Meister et al., 2010a). A systematic although minor bias is introduced towards enrichment in the nuclear interior.
Ideally, one would directly measure the 3D distance between the nuclear rim and the tagged locus. Most of the embryonic nuclei, but also many somatic nuclei in larvae and adults, can be considered spherical. There are exceptions however, for example, muscle cell nuclei, which are elongated along the body axis of the worm. In this case radial position determination requires consideration of the elongated and flat shape of nuclei performed by ad hoc software (Meister et al., 2010b).
In the case of spherical nuclei, determination of the shortest distance from the spot to the nuclear periphery is hindered by physical constraints. Resolution of the microscope in the optical imaging plane (x and y directions) is about 200 nm, while in the z direction it is often more than 450 nm. Hence, determination of the position of a spot in an xy plane is by far more precise than in the xz or yz planes. Similarly, determining where the nuclear edge is in the z direction at the top or the bottom of the sphere is difficult, even using confocal images. One way to overcome this limitation is to make use of the optical z stacks. If sections are close enough in the z direction (0.2 μm steps), and although the ‘real’ spot might lie between two imaging planes, its image will be brighter in one plane (Figure 5C). This plane is chosen as the z section of the nucleus, which contains the spot. In this plane, xy positions can be determined with high precision (about 90 nm) and are used to measure the shortest distance from the nuclear periphery to the spot (Figure 5D). However, this measurement is valid for the central z sections only: spots located at the top 25% or the bottom 25% of the nucleus cannot be used (Figure 5F, discarded volumes). In these volumes, the shortest distance from the nuclear periphery to the spot might lie in the z direction, in which case measuring this distance in the xy plane is imprecise (see above). The cross section of the nucleus in this plane is an ellipsoid or a disc. To quantify the distribution of the spot, this surface is split into three concentric zones of equal area (Figure 5D). Using equal surfaces leads to a thin outermost zone at the nuclear periphery (in terms of radial distances, between 1 and 0.82 radius) while zone 2 lies between 0.82 and 0.58 radius. Using the coordinates of the spot and the diameter of the nucleus in the axis of the spot, each spot is assigned to one of the three concentric zones. Scoring position in a number of nuclei gives a score for the locus studied in each of the three zones (Figure 5E). If a given locus does not show any preferential localization, it would be equally distributed among the three zones when scored in a sufficient number of cells (33%, red line, Figure 5E). If the locus shows preferential positioning at the nuclear rim, its 3-zone scoring will show enrichment in zone 1 (Figure 5E, dark blue). Conversely, a centrally positioned locus will show higher enrichment in zone 2 and 3 and depletion in zone 1 (Figure 5E, light blue).
The three-zone scoring method (zones, Figure 5F) and a zoning method using concentric shells (for which one would be able to precisely measure distances in the z direction; shells, Figure 5F) have been compared mathematically. The systematic error introduced by the first method (Figure 5D) is minimal if spots located in the higher and lower caps are excluded. The error introduced leads to a bias towards the most internal zones and an underestimation of the spots located at the nuclear rim (Meister et al., 2010a).
We are indebted to Kohta Ikegami for his comments and clarifications on the methods, Cristina González-Aguilera for her efforts in establishing the DamID protocol in C. elegans, Bas van Steensel for reagents and advice. We would like to thank Susan Gasser for continuous support and the Gasser and Meister laboratories for discussions, especially Lutz Gehlen for computer simulations.
Braunschweig, U., Hogan, G.J., Pagie, L., and van Steensel, B. (2009). Histone H1 binding is inhibited by histone variant H3.3. EMBO J. 28, 3635-3645. Abstract Article
Buck, M.J., and Lieb, J.D. (2004). ChIP-chip: considerations for the design, analysis, and application of genome-wide chromatin immunoprecipitation experiments. Genomics 83, 349-360. Abstract Article
Carmi, I., Kopczynski, J.B., and Meyer, B.J. (1998). The nuclear hormone receptor SEX-1 is an X-chromosome signal that determines nematode sex. Nature 396, 168-173. Abstract Article
Chen, Y., Negre, N., Li, Q., Mieczkowska, J.O., Slattery, M., Liu, T., Zhang, Y., Kim, T.K., He, H.H., Zieba, J., et al. (2012). Systematic evaluation of factors influencing ChIP-seq fidelity. Nat. Methods 9, 609-614. Abstract Article
Cochella, L., and Hobert, O. (2012). Embryonic priming of a miRNA locus predetermines postmitotic neuronal left/right asymmetry in C. elegans. Cell 151, 1229-1242. Abstract Article
Crittenden, S.L., and Kimble, J. (1999). Confocal methods for Caenorhabditis elegans. Methods Mol. Biol.122, 141-151. Abstract Article
Dickinson, D.J., Ward, J.D., Reiner, D.J., and Goldstein, B. (2013). Engineering the Caenorhabditis elegans genome using Cas9-triggered homologous recombination. Nat. Methods 10, 1028-1034. Abstract Article
Dubarry, M., Loiodice, I., Chen, C.L., Thermes, C., and Taddei, A. (2011). Tight protein-DNA interactions favor gene silencing. Genes Dev. 25, 1365-1370. Abstract Article
Duerr, J.S. Immunohistochemistry (June 19, 2006), WormBook, ed. The C. elegans Research Community, WormBook, doi/10.1895/wormbook.1.105.1, http://www.wormbook.org. Abstract
Egelhofer, T.A., Minoda, A., Klugman, S., Lee, K., Kolasinska-Zwierz, P., Alekseyenko, A.A., Cheung, M.S., Day, D.S., Gadel, S., Gorchakov, A.A., et al. (2011). An assessment of histone-modification antibody quality. Nat. Struct. Mol. Biol. 18, 91-93. Abstract Article
Ercan, S., Dick, L.L., and Lieb, J.D. (2009). The C. elegans dosage compensation complex propagates dynamically and independently of X chromosome sequence. Curr. Biol. 19, 1777-1787. Abstract Article
Ercan, S., Giresi, P.G., Whittle, C.M., Zhang, X., Green, R.D., and Lieb, J.D. (2007). X chromosome repression by localization of the C. elegans dosage compensation machinery to sites of transcription initiation. Nat. Genet. 39, 403-408. Abstract
Evans, T.C., ed. Transformation and microinjection (April 6, 2006), WormBook, ed. The C. elegans Research Community, WormBook, doi/10.1895/wormbook.1.108.1, http://www.wormbook.org. Abstract
Fakhouri, T.H., Stevenson, J., Chisholm, A.D., and Mango, S.E. (2010). Dynamic chromatin organization during foregut development mediated by the organ selector gene PHA-4/FoxA. PLoS Genet. 6 e1001060. Abstract Article
Fox, R.M., Watson, J.D., Von Stetina, S.E., McDermott, J., Brodigan, T.M., Fukushige, T., Krause, M., and Miller, D.M., 3rd (2007). The embryonic muscle transcriptome of Caenorhabditis elegans. Genome Biol. 8, R188. Abstract Article
Frokjaer-Jensen, C., Davis, M.W., Ailion, M., and Jorgensen, E.M. (2012). Improved Mos1-mediated transgenesis in C. elegans. Nat. Methods 9, 117-118. Abstract Article
Frokjaer-Jensen, C., Davis, M.W., Hopkins, C.E., Newman, B.J., Thummel, J.M., Olesen, S.P., Grunnet, M., and Jorgensen, E.M. (2008). Single-copy insertion of transgenes in Caenorhabditis elegans. Nat. Genet. 40, 1375-1383. Abstract Article
Galy, V., Mattaj, I.W., and Askjaer, P. (2003). Caenorhabditis elegans nucleoporins Nup93 and Nup205 determine the limit of nuclear pore complex size exclusion in vivo. Mol. Biol. Cell 14, 5104-5115. Abstract
Germann, S., Juul-Jensen, T., Letarnec, B., and Gaudin, V. (2006). DamID, a new tool for studying plant chromatin profiling in vivo, and its use to identify putative LHP1 target loci. Plant J. 48, 153-163. Abstract
Gerstein, M.B., Lu, Z.J., Van Nostrand, E.L., Cheng, C., Arshinoff, B.I., Liu, T., Yip, K.Y., Robilotto, R., Rechtsteiner, A., Ikegami, K., et al. (2010). Integrative analysis of the Caenorhabditis elegans genome by the modENCODE project. Science 330, 1775-1787. Abstract Article
González-Aguilera, C., Ikegami, K., Ayuso, C., de Luis, A., Iñiguez, M., Cabello, J., Lieb, J.D., and Askjaer, P. (2014) Genome-wide analysis links emerin to neuromuscular junction activity in Caenorhabditis elegans. Genome Biol. 15, R21. Abstract Article
Gonzalez-Serricchio, A.S., and Sternberg, P.W. (2006). Visualization of C. elegans transgenic arrays by GFP. BMC Genet. 7, 36. Abstract Article
Greil, F., Moorman, C., and van Steensel, B. (2006). DamID: mapping of in vivo protein-genome interactions using tethered DNA adenine methyltransferase. Methods Enzymol. 410, 342-359. Abstract Article
Hecht, A., and Grunstein, M. (1999). Mapping DNA interaction sites of chromosomal proteins using immunoprecipitation and polymerase chain reaction. Methods Enzymol. 304, 399-414. Abstract
Ikegami, K., Egelhofer, T., Strome, S., and Lieb, J.D. (2010). Caenorhabditis elegans chromosome arms are anchored to the nuclear membrane via discontinuous association with LEM-2. Genome Biol. 11, R120. Abstract Article
Jans, J., Gladden, J.M., Ralston, E.J., Pickle, C.S., Michel, A.H., Pferdehirt, R.R., Eisen, M.B., and Meyer, B.J. (2009). A condensin-like dosage compensation complex acts at a distance to control expression throughout the genome. Genes Dev. 23, 602-618. Abstract Article
Kaltenbach, L., Horner, M.A., Rothman, J.H., and Mango, S.E. (2000). The TBP-like factor CeTLF is required to activate RNA polymerase II transcription during C. elegans embryogenesis. Mol. Cell 6, 705-713. Abstract Article
Kalverda, B., and Fornerod, M. (2010). Characterization of genome-nucleoporin interactions in Drosophila links chromatin insulators to the nuclear pore complex. Cell Cycle 9, 4812-4817. Abstract
Kiefer, J.C., Smith, P.A., and Mango, S.E. (2007). PHA-4/FoxA cooperates with TAM-1/TRIM to regulate cell fate restriction in the C. elegans foregut. Dev. Biol. 303, 611-624. Abstract
Kolasinska-Zwierz, P., Down, T., Latorre, I., Liu, T., Liu, X.S., and Ahringer, J. (2009). Differential chromatin marking of introns and expressed exons by H3K36me3. Nat. Genet. 41, 376-381. Abstract Article
Kranz, A.L., Jiao, C.Y., Winterkorn, L.H., Albritton S.E., Kramer, M., and Ercan S. (2013). Genome-wide analysis of condensin binding in Caenorhabditis elegans. Genome Biol. 14, R112. Abstract Article
Kudron, M., Niu, W., Lu, Z., Wang, G., Gerstein, M., Snyder, M., and Reinke, V. (2013). Tissue-specific direct targets of Caenorhabditis elegans Rb/E2F dictate distinct somatic and germline programs. Genome Biol. 14, R5. Abstract Article
Kuo, M.H., and Allis, C.D. (1999). In vivo cross-linking and immunoprecipitation for studying dynamic Protein:DNA associations in a chromatin environment. Methods 19, 425-433. Abstract Article
Landt, S.G., Marinov, G.K., Kundaje, A., Kheradpour, P., Pauli, F., Batzoglou, S., Bernstein, B.E., Bickel, P., Brown, J.B., Cayting, P., et al. (2012). ChIP-seq guidelines and practices of the ENCODE and modENCODE consortia. Genome Res. 22, 1813-1831. Abstract Article
Liu, T., Rechtsteiner, A., Egelhofer, T.A., Vielle, A., Latorre, I., Cheung, M.S., Ercan, S., Ikegami, K., Jensen, M., Kolasinska-Zwierz, P., et al. (2011). Broad chromosomal domains of histone modification patterns in C. elegans. Genome Res. 21, 227-236. Abstract Article
Luo, S.D., Shi, G.W., and Baker, B.S. (2011). Direct targets of the D. melanogaster DSXF protein and the evolution of sexual development. Development 138, 2761-2771. Abstract Article
Mangone, M., Manoharan, A.P., Thierry-Mieg, D., Thierry-Mieg, J., Han, T., Mackowiak, S.D., Mis, E., Zegar, C., Gutwein, M.R., Khivansara, V., et al. (2010). The landscape of C. elegans 3'UTRs. Science 329, 432-435. Abstract Article
Mattout, A., Pike, B.L., Towbin, B.D., Bank, E.M., Gonzalez-Sandoval, A., Stadler, M.B., Meister, P., Gruenbaum, Y., and Gasser, S.M. (2011). An EDMD mutation in C. elegans lamin blocks muscle-specific gene relocation and compromises muscle integrity. Curr. Biol. 21, 1603-1614. Abstract Article
Meister, P., Gehlen, L., Varela, E., Kalck, V., and Gasser, S.M. (2010a). Visualizing yeast chromosomes and nuclear architecture. Methods Enzymol. 470, 537-569. Abstract Article
Meister, P., Towbin, B.D., Pike, B.L., Ponti, A., and Gasser, S.M. (2010b). The spatial dynamics of tissue-specific promoters during C. elegans development. Genes Dev. 24, 766-782. Abstract Article
Moorman, C., Sun, L.V., Wang, J., de Wit, E., Talhout, W., Ward, L.D., Greil, F., Lu, X.J., White, K.P., Bussemaker, H.J., and van Steensel, B. (2006). Hotspots of transcription factor colocalization in the genome of Drosophila melanogaster. Proc. Natl. Acad. Sci. U. S. A. 103, 12027-12032. Abstract Article
Negre, N., Hennetin, J., Sun, L.V., Lavrov, S., Bellis, M., White, K.P., and Cavalli, G. (2006). Chromosomal distribution of PcG proteins during Drosophila development. PLoS Biol. 4, e170. Abstract Article
Niu, W., Lu, Z.J., Zhong, M., Sarov, M., Murray, J.I., Brdlik, C.M., Janette, J., Chen, C., Alves, P., Preston, E., et al. (2011). Diverse transcription factor binding features revealed by genome-wide ChIP-seq in C. elegans. Genome Res. 21, 245-254. Abstract Article
Orian, A., van Steensel, B., Delrow, J., Bussemaker, H.J., Li, L., Sawado, T., Williams, E., Loo, L.W., Cowley, S.M., Yost, C., et al. (2003). Genomic binding by the Drosophila Myc, Max, Mad/Mnt transcription factor network. Genes Dev. 17, 1101-1114. Abstract Article
Park, P.J. (2009). ChIP-seq: advantages and challenges of a maturing technology. Nat. Rev. Genet. 10, 669-680. Abstract Article
Pickersgill, H., Kalverda, B., de Wit, E., Talhout, W., Fornerod, M., and van Steensel, B. (2006). Characterization of the Drosophila melanogaster genome at the nuclear lamina. Nat. Genet. 38, 1005-1014. Abstract Article
Rechtsteiner, A., Ercan, S., Takasaki, T., Phippen, T.M., Egelhofer, T.A., Wang, W., Kimura, H., Lieb, J.D., and Strome, S. (2010). The histone H3K36 methyltransferase MES-4 acts epigenetically to transmit the memory of germline gene expression to progeny. PLoS Genet. 6, e1001091. Abstract Article
Robert, V., and Bessereau, J.L. (2007). Targeted engineering of the Caenorhabditis elegans genome following Mos1-triggered chromosomal breaks. EMBO J. 26, 170-183. Abstract Article
Robert, V.J., Sijen, T., van Wolfswinkel, J., and Plasterk, R.H. (2005). Chromatin and RNAi factors protect the C. elegans germline against repetitive sequences. Genes Dev. 19, 782-787. Abstract Article
Robinett, C.C., Straight, A., Li, G., Willhelm, C., Sudlow, G., Murray, A., and Belmont, A.S. (1996). In vivo localization of DNA sequences and visualization of large-scale chromatin organization using lac operator/repressor recognition. J. Cell Biol. 135, 1685-1700. Abstract Article
Rohner, S., Gasser, S.M., and Meister, P. (2008). Modules for cloning-free chromatin tagging in Saccharomyces cerevisae. Yeast 25, 235-239. Abstract Article
Rohner, S., Kalck, V., Wang, X., Ikegami, K., Lieb, J.D., Gasser, S.M., and Meister, P. (2013). Promoter- and RNA polymerase II-dependent hsp-16 gene association with nuclear pores in Caenorhabditis elegans. J. Cell Biol. 200, 589-604. Abstract Article
Sarov, M., Murray, J.I., Schanze, K., Pozniakovski, Niu, W., Angermann, K., Hasse, S., Rupprecht, M., Vinis, E., Tinney, M., et al. (2012). A Genome-scale resource for in vivo tag-based protein function exploration in C. elegans. Cell 150, 855-866. Abstract Article
Schuster, E., McElwee, J.J., Tullet, J.M., Doonan, R., Matthijssens, F., Reece-Hoyes, J.S., Hope, I.A., Vanfleteren, J.R., Thornton, J.M., and Gems, D. (2010). DamID in C. elegans reveals longevity-associated targets of DAF-16/FoxO. Mol. Syst. Biol. 6, 399. Abstract Article
Sha, K., Gu, S.G., Pantalena-Filho, L.C., Goh, A., Fleenor, J., Blanchard, D., Krishna, C., and Fire, A. (2010). Distributed probing of chromatin structure in vivo reveals pervasive chromatin accessibility for expressed and non-expressed genes during tissue differentiation in C. elegans. BMC Genomics 11, 465. Abstract Article
Song, S., Cooperman, J., Letting, D.L., Blobel, G.A., and Choi, J.K. (2004). Identification of cyclin D3 as a direct target of E2A using DamID. Mol. Cell. Biol. 24, 8790-8802. Abstract Article
Steglich, B., Filion, G. J., van Steensel, B., and Ekwall, K. (2012). The inner nuclear membrane proteins Man1 and Ima1 link to two different types of chromatin at the nuclear periphery in S. pombe. Nucleus 3, 77-87. Abstract Article
Steiner, F.A., Talbert, P.B., Kasinathan, S., Deal, R.B., and Henikoff, S. (2012). Cell type-specific nuclei purification from whole animals for genome-wide expression and chromatin profiling. Genome Res. 22, 766-777. Abstract Article
Stringham, E.G., Dixon, D.K., Jones, D., and Candido, E.P. (1992). Temporal and spatial expression patterns of the small heat shock (hsp16) genes in transgenic Caenorhabditis elegans. Mol. Biol. Cell 3, 221-233. Abstract
Towbin, B.D., Gonzalez-Aguilera, C., Sack, R., Gaidatzis, D., Kalck, V., Meister, P., Askjaer, P., and Gasser, S.M. (2012). Step-wise methylation of histone H3K9 positions heterochromatin at the nuclear periphery. Cell 150, 934-947. Abstract Article
Towbin, B.D., Meister, P., Pike, B.L., and Gasser, S.M. (2010). Repetitive transgenes in C. elegans accumulate heterochromatic marks and are sequestered at the nuclear envelope in a copy-number- and lamin-dependent manner. Cold Spring Harb. Symp. Quant. Biol. 75, 555-565. Abstract Article
Updike, D.L., and Mango, S.E. (2006). Temporal regulation of foregut development by HTZ-1/H2A.Z and PHA-4/FoxA. PLoS Genet. 2, e161. Abstract Article
van Bemmel, J.G., Filion, G.J., Rosado, A., Talhout, W., de Haas, M., van Welsem, T., van Leeuwen, F., and van Steensel, B. (2013). A network model of the molecular organization of chromatin in Drosophila. Mol. Cell 49, 759-771. Abstract
van Steensel, B., and Henikoff, S. (2000). Identification of in vivo DNA targets of chromatin proteins using tethered dam methyltransferase. Nat. Biotechnol. 18, 424-428. Abstract Article
Venkatasubrahmanyam, S., Hwang, W.W., Meneghini, M.D., Tong, A.H., and Madhani, H.D. (2007). Genome-wide, as opposed to local, antisilencing is mediated redundantly by the euchromatic factors Set1 and H2A.Z. Proc. Natl. Acad. Sci. U. S. A. 104, 16609-16614. Abstract Article
Vogel, M. J., Guelen, L., de Wit, E., Peric-Hupkes, D., Loden, M., Talhout, W., Feenstra, M., Abbas, B., Classen, A. K., and van Steensel, B. (2006). Human heterochromatin proteins form large domains containing KRAB-ZNF genes. Genome Res. 16, 1493-1504. Abstract Article
Vogel, M.J., Peric-Hupkes, D., and van Steensel, B. (2007). Detection of in vivo protein-DNA interactions using DamID in mammalian cells. Nat. Protoc. 2, 1467-1478. Abstract Article
Von Stetina, S.E., Watson, J.D., Fox, R.M., Olszewski, K.L., Spencer, W.C., Roy, P.J., and Miller, D.M., 3rd (2007). Cell-specific microarray profiling experiments reveal a comprehensive picture of gene expression in the C. elegans nervous system. Genome Biol. 8, R135. Abstract Article
Whittle, C.M., McClinic, K.N., Ercan, S., Zhang, X., Green, R.D., Kelly, W.G., and Lieb, J.D. (2008). The genomic distribution and function of histone variant HTZ-1 during C. elegans embryogenesis. PLoS Genet. 4, e1000187. Abstract Article
Wood, A.J., Lo, T.W., Zeitler, B., Pickle, C.S., Ralston, E.J., Lee, A.H., Amora, R., Miller, J.C., Leung, E., Meng, X., et al. (2011). Targeted genome editing across species using ZFNs and TALENs. Science 333, 307. Abstract Article
Woolcock, K.J., Gaidatzis, D., Punga, T., and Buhler, M. (2011). Dicer associates with chromatin to repress genome activity in Schizosaccharomyces pombe. Nat. Struct. Mol. Biol.18, 94-99. Abstract Article
*Edited by Oliver Hobert Last revised May 23, 2013, Published April 2, 2014. This chapter should be cited as: Askjaer P., et al. Modern techniques for the analysis of chromatin and nuclear organization in C. elegans (April 2, 2014), WormBook, ed. The C. elegans Research Community, WormBook, doi/10.1895/wormbook.1.169.1, http://www.wormbook.org.
Copyright: © 2014 Peter Askjaer, Sevinç Ercan, Peter Meister. This is an open-access article distributed under the terms of the Creative Commons Attribution License, which permits unrestricted use, distribution, and reproduction in any medium, provided the original author and source are credited.
§To whom correspondence should be addressed: pask@upo.es, se71@nyu.edu, or peter.meister@izb.unibe.ch
 All WormBook content, except where otherwise noted, is licensed under a Creative Commons Attribution License.