 Embryo series courtesy of Einhard Schierenberg
Table of Contents
Abstract
This chapter describes four different protocols used to assay thermotaxis navigation behavior of single, or populations of, C. elegans hermaphrodites on spatial thermal gradients within the physiological temperature range (15-25°C). A method to assay avoidance of noxious temperatures is also described.
As first described by Hedgecock and Russell (Hedgecock and Russell, 1975), C. elegans exhibits complex and experience-dependent navigation behaviors on spatial thermal gradients. The specific navigational strategy that C. elegans exhibits when experiencing a given ambient temperature (T) is dictated by a ‘memory’ of its cultivation temperature (referred to throughout this chapter as Tc). At T>Tc, animals move down the gradient towards colder temperatures in a behavior called negative thermotaxis (also called cryophilic behavior); at temperatures around Tc, animals track isotherms; at T<Tc, animals are either atactic or move up the gradient towards warmer temperatures (positive thermotaxis or thermophilic behavior) (reviewed in Garrity et al., 2010; Kimata et al., 2012).
Although not unexpected, it has now become clear that the specific assay conditions and the method used for quantifying the results greatly influence the outcome of thermotaxis behavioral assays (Beverly et al., 2011; Jurado et al., 2010; Ramot et al., 2008). Several different thermotaxis behavioral assay protocols have been described in the literature (eg., Mori and Ohshima, 1995; Ramot et al., 2008; Ryu and Samuel, 2002; Yamada and Ohshima, 2003; Zariwala et al., 2003; summarized in Kimata et al., 2012). Variability in key experimental and analyses parameters has led to some confusion about the contributions of specific molecules and neurons to thermotaxis behavior. Critical experimental variables include the steepness and stability of the thermal gradient, time period of the assay, the temperature at which the assay is initiated, and the cultivation conditions (temperature, humidity) of the animals. Critical measurement issues include whether the behaviors of populations or individual animals are being monitored, and whether end-point accumulation or underlying navigational decisions are being quantified.
In this chapter we present updated protocols for thermotaxis behavioral assays and one for noxious heat avoidance. A microfluidic device for measuring orientation responses of semi-restrained worms to temperature steps has also been described (McCormick et al., 2011); this method is not included here. Four of the provided protocols allow measurement of thermotaxis and/or isothermal tracking behavior within the physiological temperature range (15-25°C) (Sections 2, 4, 5); an additional protocol describes a method to measure avoidance of noxious temperature ranges (Section 3). The protocols also describe different data analysis methods and the use of either single animals or populations. No one protocol is better or worse than others, each simply measures different parameters. The bottom line is that experimenters should not only ensure that there is consistency across thermotaxis protocols used within and across experiments, but also report all relevant experimental variables. This allows the results to be interpreted in the context of the specific experimental method utilized, as well as to be reproduced reliably.
The thermal preference assay (Hedgecock and Russell, 1975) captures the combined effects of both thermotaxis (a biased random walk) and isothermal tracking (reviewed by Garrity et al., 2010; Hedgecock and Russell, 1975; Kimata et al., 2012) by exposing a population of animals grown at temperatures between 15 and 25°C to a stable, one-dimensional, linear thermal gradient between 15°C and 25°C. This protocol describes an updated implementation of this assay (Ramot et al., 2008) that uses thermoelectric coolers to establish stable, well-controlled, and adjustable linear thermal gradients.
Animals: We use synchronized populations of L4 or young adult animals and aim to distribute between 50 and 400 worms on to each assay plate. Fewer animals increase assay-to-assay variability, while more animals increase the chances of animal-to-animal interactions. Care should be taken to control feeding state since animals deprived of food for more than 3 hours exhibit altered responses to thermal gradients in the physiological range (15 to 25°C) (Chi et al., 2007; Hedgecock and Russell, 1975; Ramot et al., 2008). Similarly, as mentioned above, thermotaxis behavior is sensitive to Tc (Hedgecock and Russell, 1975). Consequently, this variable must also be tightly controlled.
Assay conditions: High relative humidity (RH) affects the response to thermal gradients (Murakami et al., 2005; Zhao et al., 2003). One solution to this complication is to conduct assays in a humidity-controlled environment (30% RH is a good choice). If such an environment is not available, an alternative is to measure RH with a digital hygrometer and to reject assays conducted whenever RH exceeds 50%.
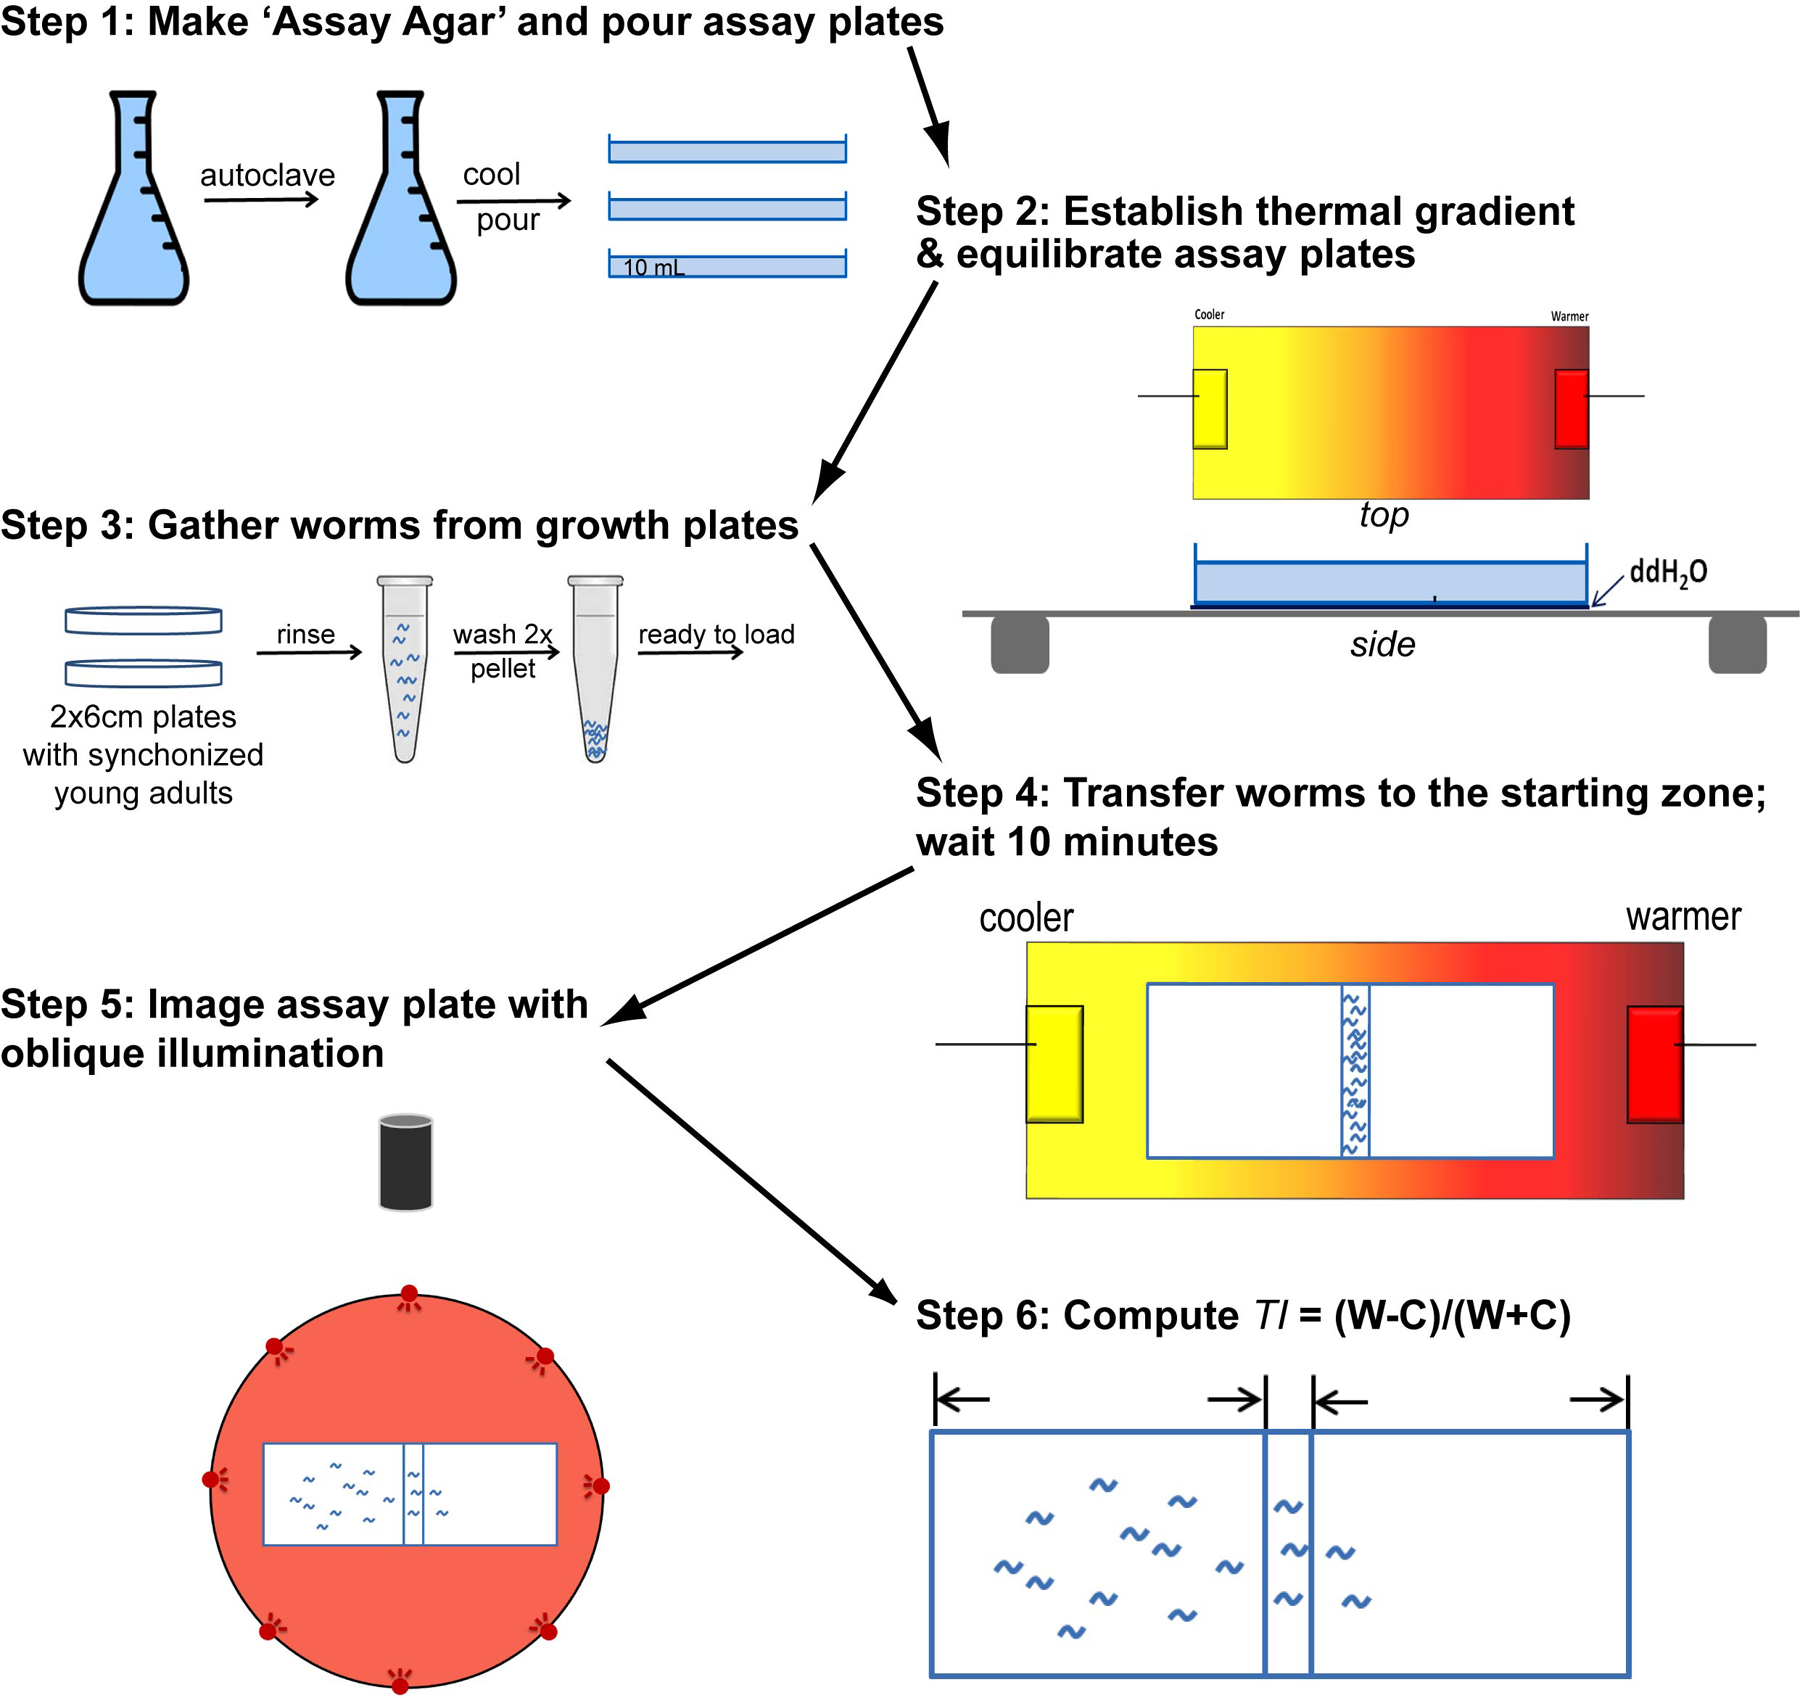
Figure 1 is a graphical summary of the assay procedure.
|
Figure 1. Graphical summary of the procedure for measuring thermal preference of a population of nematodes on linear thermal gradients (Section 2). This procedure assumes that synchronized populations of the desired animals have been prepared in advance.
We use vented, rectangular assay plates (7.6 cm l x 5 cm w x 1 cm d, LabScientific, Livingston, NJ) in place of circular Petri plates to simplify data handling and interpretation. Assay plates are prepared fresh each day and allowed to cool and dry at room temperature with the lid off for 1.5 – 2 hr. (When RH is low, we use shorter drying times. When RH is high, longer drying times are needed.). Use a leveling gel casting platform to ensure a level surface. Assay plates are filled with 10 mL of cool (≤55°C), liquid ‘assay agar’, assembled as follows: 1) Dissolve agar (17 g) and NaCl (3 g) in 975 mL ddH20, autoclave for 20 min; 2) Cool to 55°C; 3) Add CaCl2 (1 mL of 1 M solution), MgSO4 (1 mL of 1 M solution), and KH2PO4 (25 mL of 1 M solution, pH 6.0).
The general set-up consists of an aluminum plate (25 cm l × 12 cm w, 1.6 mm d) with coolers attached to each end. Controllers and feedback thermistors independently control the temperature of each cooler. Cold water is delivered to the thermoelectric coolers either from the tap or from a refrigerated recirculating chiller. A handheld infrared thermometer is used to measure temperature on the thermal gradient plates and on assay plates. See below for equipment sources.
To establish the desired thermal gradient across the aluminum plate (we typically use a gradient of 1.0°C/cm), first, turn on your cooling system (tap water or refrigerated re-circulating pump). Next, use the controller software to load the desired temperature on to the controllers for the thermoelectric cooler at each end. Position assay plates at the center of the aluminum gradient plate and allow them to equilibrate for ~10 min, generating the desired linear thermal gradient across the agar surface. Verify temperature using a hand-held infrared thermometer. Use a thin layer of water between the assay plate and the aluminum gradient plate to maximize heat transfer.
Once assay plates reach thermal equilibrium, we transfer synchronized, well-fed young adult worms from two 6 cm growth plates in ddH2O to a 1.5 mL centrifuge tube. Spin at low speed to pellet the animals and wash twice in ddH2O, resuspend the animals in 100 µL and transfer 20 µL to a narrow starting zone at the center of each assay plate. Aim for ~200 animals/assay. Disperse the droplet across the surface using a ‘brush’ made from a thin gel-sequencing pipette tip or fine paintbrush. Try not to gouge the agar since the animals will burrow. The assay clock starts as soon as animals begin to crawl away from the starting zone, which should take 1-2 min. We conduct assays for 10 min, since the distribution of animals reaches a steady state in this time window (Ramot et al., 2008).
We take a digital image of each assay plate using a digital camera + macro lens and oblique illumination delivered by a ring of red LEDs as described (Glauser et al., 2011). These images are used to determine the final position of each worm and to calculate a thermotaxis index: TI = (W-C)/(W+C) (where W indicates warm and C indicates cold), excluding any animals that may remain in the starting zone. A TI of -1 indicates that all of the animals moved to the colder side of the plate, while a TI of +1 indicates that all of the animals moved to the warmer side. Two methods are available for counting animals: 1) use particle counting macros in ImageJ (download from http://http://rsbweb.nih.gov/ij/; see also http://en.wikipedia.org/wiki/ImageJ), as described (Glauser et al., 2011), or 2) kill animals in situ by exposure to choloroform vapor and count them manually under a stereomicroscope as described by Ramot et al. (Ramot et al., 2008).
Polystat Refrigerated Circulating Waterbath (Catalog No.12108-00, Cole-Parmer)
Thermoeletric (Peltier) Device (MCW50-T and MCW60-T VGA Coolers, Swiftech)
Thermoelectric Module Temperature Controller (5C7–365 and 5C7–378, McShane, Inc.)
Photo Acquisition System: IC-Capture 2.0 controlled USB CCD Monochrome Camera (Model DMK 21BU04, The Imaging Source); Light source: Red LEDs ring controlled by a variable voltage regulator (Model TDGC-0.5KM, Variac.com)
PC to connect to temperature controllers and to capture images
Infrared thermometer: Mastercool 5226-A-SP or equivalent: ±2% accuracy, 0.1°C resolution
The same equipment described for the population thermal preference assay (Section 2) can be used to conduct noxious thermogradient assays designed to measure the population response to thermal gradients in the noxious range, >26°C (Glauser et al., 2011). This behavior persists in animals deprived of food for more than 3 hours, allowing the study of noxious heat avoidance independently of thermotaxis. In this assay, the center of the gradient is set to ∼33°C and a gradient of ∼1.0°C/cm is established. The starting zone is established at the cooler end of the assay plate by placing washed animals (as described in Section 2.2.3) in a 1 cm-wide vertical stripe. Animals are allowed to move freely for 15 min. The distribution of animals is measured as follows: 1) a digital image is acquired using oblique illumination via LEDs; 2) the position of each worm is determined using particle tracking macros in ImageJ; and 3) the plate is divided into 15 bins of equal width and the number of worms in each bin is counted automatically.
This section describes two thermotaxis (Ttx) assay methods to quantify the complex behavior exhibited by C. elegans: radial Ttx assay (Mori and Ohshima, 1995) and linear Ttx assay (Ito et al., 2006).
The working bench should be level. There should be no source of air currents and vibration nearby—such as a centrifuge or a draft chamber. Do not use an incubator for thermotaxis assays because it is strong source of wind from the fan and vibration from the compressor. Room temperature should be kept at 25 ± 1°C. Avoid local temperature changes caused by sunlight. Low humidity (20-30%) is preferred for the assay.
Incubator for animal growth: A small volume (100-150L) incubator is preferred to maintain stable temperature.
Cultivation plates: Use a 6 cm plate containing 14 ml of NGM, which is the minimal volume required to establish a sufficient bacterial lawn. The NGM plates are spread with overnight-cultured E. coli, incubated for a day at room temperature (or overnight at 37°C), and stored at room temperature. Do not use old seeded NGM plates (over 2 weeks).
Animal cultivation: Use healthy adult animals from uncrowded plates. Animals should be maintained by transferring 2 to 3 animals to a new NGM plate before starving. Do not use starved animals or those chunked from a starved plate. To avoid crowding, you may transfer ∼15 L4 larvae to a fresh and pre-incubated NGM plate prior to the assay. Grow these transferred animals for 8-24 hr (depending on cultivation temperature) and use for assays. To obtain sufficient animals for the linear Ttx assay, pick a single L4 animal onto a 6 cm plate containing 14 ml of nematode growth medium (NGM) with food (OP50) and incubate the plates for 72 hr at 23°C, 90 hr at 20°C, or 100 hr at 17°C, to grow sufficient progeny. See Section 4.6 below for the protocol for preparation of starved animals.
Ttx medium consists of 2% agar, 0.3% NaCl and 25 mM potassium phosphate buffer (pH 6.0). After autoclaving, pour exactly 8 ml of the medium into a 9 cm plate. Store at 4°C and use within 2 weeks. For the temperature source, we use vials filled with frozen glacial acetic acid (stored at 4°C). Glass vials are 10 cm long and 2.7 cm in diameter. Freeze glacial acetic acid at −20°C and store at 4°C.
Prior to the assay, remove lids of Ttx plates and dry the plates for about 30 min at room temperature. Do not dry Ttx plates in a windy place like in a fume hood. Overdrying Ttx plates causes the plates’ surface to become rough. The surface of Ttx plates should be smooth as a mirror.
Invert the Ttx plates; mark the center and a point 1.5 cm from the edge on the bottom of the plate.
Take the vials containing frozen glacial acetic acid out from the cold room and leave the vials for 10 min at room temperature (25°C) to allow the acetic acid to start to melt. The melting point of glacial acetic acid is 16.7°C.
Place the vial at the center of the Ttx plate.
Leave the plates for ∼10-15 min at room temperature to form a stable radial thermal gradient on the surface of the Ttx plate. The thermal gradient is maintained for 1 hr on the plate with the glacial acetic acid vial. Replace the vials when half the glacial acid is melted.
Remove the vial and place an animal at the marked point near the edge of the Ttx plate. Do not scratch the surface of the Ttx plate and avoid bringing E. coli onto the Ttx plate. We generally transfer the animal first to either the unseeded part of a seeded NGM plate or onto an unseeded NGM plate for a few minutes before transferring to the Ttx plate.
Replace the vial at the center of the Ttx plate.
Leave the plates for 50-60 min at room temperature. Ensure that the plate is not subjected to wind or vibration.
Remove the vial and put several drops of chloroform on the lid to stop animal movement.
Place the Ttx plates at 4°C until they are photographed.
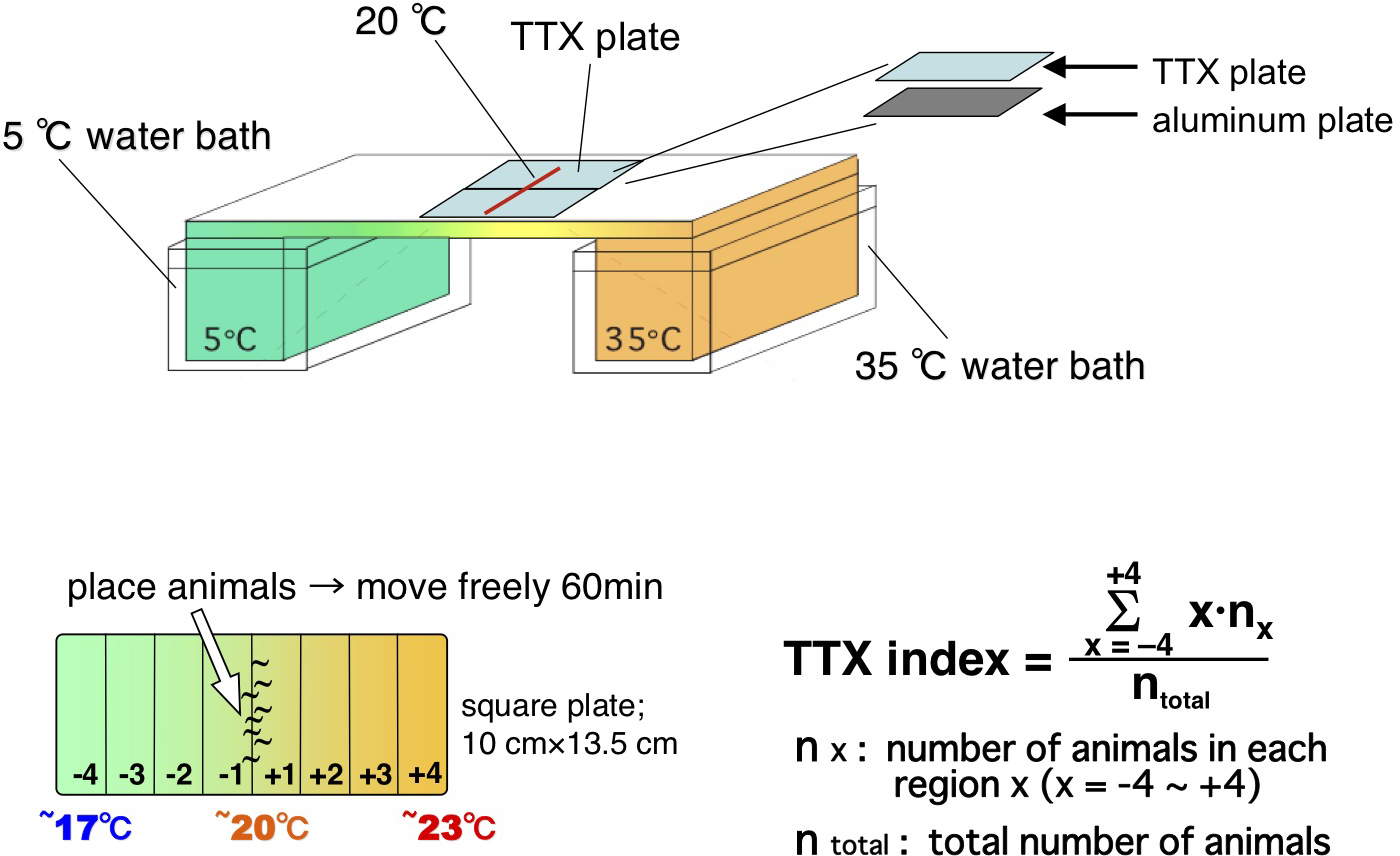
Equipment required for establishing the linear thermal gradient was originally described by Hedgecock and Russell (Hedgecock and Russell, 1975). A stable, linear thermal gradient is established on a 60 cm long aluminum platform, one end of which is placed in a water bath at 5°C and the opposite end in a water bath at 35°C. A thin aluminum (135 mm × 95 mm x 1 mm) plate is placed on the aluminum platform (Figure 2). A square Ttx plate (14 cm × 10 cm x 1.45 cm in height) containing 18 ml of Ttx medium (see Section 4.1 above) is placed on the aluminum plate such that the center of the Ttx plate is aligned at the surface temperature of 20°C. The space between the bottom of the Ttx plate and the aluminum plate is filled with water. This procedure establishes a linear thermal gradient ranging from approximately 17 to 23°C on the agar surface.
Collect the animals (typically from 3-5 NGM plates per assay) with 1 ml of S-basal buffer at 20°C. Wash once with S-basal buffer and then once with water. These washing steps should be carried out within 6 min in a water bath maintained at 20°C. Place approximately 100–400 animals at the center of the Ttx plate.
Remove excess water with tissue paper within 2 min. After the animals begin to crawl on the agar surface, leave the Ttx plates undisturbed for 60 min.
Stop the assay by placing several drops of chloroform gas on the assay lid. Count the number of adult animals in each of the eight regions of the plate (Figure 2). The Ttx index is calculated as shown in Figure 2.
9 cm starvation plates: The medium consists of 2% agar, 1 mM CaCl2, 1 mM MgSO4, and 25 mM pH 6.0 potassium phosphate. After autoclaving, pour exactly 8 ml of the medium into a 9 cm plate. Store at 4°C and use within one month. NG buffer: NG buffer consists of 0.3% NaCl, 1 mM CaCl2, 1 mM MgSO4, and 25 mM pH 6.0 potassium phosphate.
Two methods for starving animals prior to performing either the radial or the linear Ttx assay are provided.
Method 1.
Incubate starvation plates at the assay temperature for >3 hr.
Incubate NG buffer in the water bath set at the assay temperature.
Collect well-fed animals into a tube with pre-incubated NG buffer.
Wash animals twice with NG buffer.
Transfer animals to the pre-incubated starvation plate.
Seal the starvation plate with Parafilm®.
Incubate at the assay temperature for assay for the appropriate time (at 17°C for 2-3 hr or at 25°C for 30 min) prior to performing the assay.
Method 2
Incubate starvation plate at assay temperature for >3 hr.
Transfer 20 animals to the pre-incubated starvation plate.
Seal the starvation plate with Parafilm®.
Incubate at 17°C for 2-3 hr or at 25°C for 30 min prior to performing the assay.
Below, we present a simple linear thermal gradient apparatus that utilizes Peltier-effect thermoelectric elements and resistive cartridge heaters to establish highly reproducible and stable gradients on agar plates with simultaneous monitoring of worm movements using video microscopy.
We note that the larger format of the current assay (using 22 cm plates instead of traditional 9 cm round plates) represents a qualitative improvement over previous assays (Chi et al., 2007; Clark et al., 2007; Ryu and Samuel, 2002). More worms can be studied in each experiment, and the low population density leads to fewer interactions between worms. The ability to follow individual trajectories of individual worms that are uninterrupted by collisions with other animals improves the statistical analysis of the navigational strategy.
We establish a thermal gradient across an anodized aluminum slab (24 in. x 12 in. x 1/4 in.) by fixing the temperatures of two aluminum reservoir blocks (4 in. x 12 in. x 1.5 in.) underneath each end of the slab; between the blocks and the top slab are thin steel diffuser plates (4 in. x 12 in. x 1/16 in.). To one reservoir block we affix a pair of 120W thermoelectric coolers (TECs), which pump heat between the reservoir block and a commercial water block (Swiftech MCW-82) through which flows a circulating temperature-controlled bath of antifreeze coolant (using a VWR 1160S chiller). In the other reservoir block we drill holes and insert four 100 W resistive cartridge heaters (e.g., McMaster-Carr 3618K416 or similar). The TECs and heaters create a thermal gradient across the middle of the slab, atop which can be placed a square 22 × 22 cm of agar approximately 5 mm thick, either in a plastic dish or on a thin (1/16 in.) aluminum sheet. Sufficient glycerol between the dish/sheet and the top surface of the slab ensures thermal contact (Figure 3). The entire structure is housed in a dark chamber to prevent stray light and air currents from affecting visibility of the worms and temperature stability.
|
Figure 3. Side and top schematic views of the linear thermal gradient apparatus (Section 5). Cold and warm reservoirs are temperature controlled with independent PID circuits, while crawling worms are imaged with a CCD camera under red LED illumination.
Separate feedback loops are needed for “hot” and “cold” side temperature control. We use separate temperature sensors glued to the top surface of the aluminum slab near the hot and cold edges of the gradient. On the cold side, a PID controller, H-bridge amplifier (both from Accuthermo) and 12 V switching power supply (Oven Industries) act to control the TEC activity, while on the hot side a PID controller regulates a solid state relay (SSR) that passes 120 V ac power to the cartridge heaters. This system can typically achieve at least a 20°C temperature difference across 16 in. of the aluminum slab. Typical approximate gradients employed are 0.2°C/cm for navigation and 0.5°C/cm for isothermal tracking experiments. To achieve steeper gradients with a similar system, one could use more powerful TECs, additional cartridge heaters, or make the aluminum slab narrower. Also note that the VWR chiller temperature can be set very low (near 0°C) in this configuration, since the liquid bath is used only on the cold side of the gradient. It is also useful to cover the reservoir blocks and the bottom of the plate with an insulating foam.
The temperature gradient at the agar surface will be less steep than the gradient across the aluminum slab, and needs to be verified with each setting of the temperature controllers. This can easily be done using a hand-held digital thermometer (e.g., Fluke 50 Series).
Uniform illumination and high-contrast images are necessary to visualize worms navigating the linear thermal gradients. We have engineered a simple dark-field illuminator using four bars, each with 48 bright LEDs, in a plane just above the agar plate. Using fresh, clean plates without surface defects, the only light-scattering objects are the worms themselves. These high-contrast images of the worms can be recorded using a CCD camera (e.g., Panasonic WV-BP554, or Mightex BCE-B050-U) equipped with a zoom lens that captures the image of the whole plate (8 mm to capture an entire 22 × 22 cm plate, longer for better images with a smaller field of view).
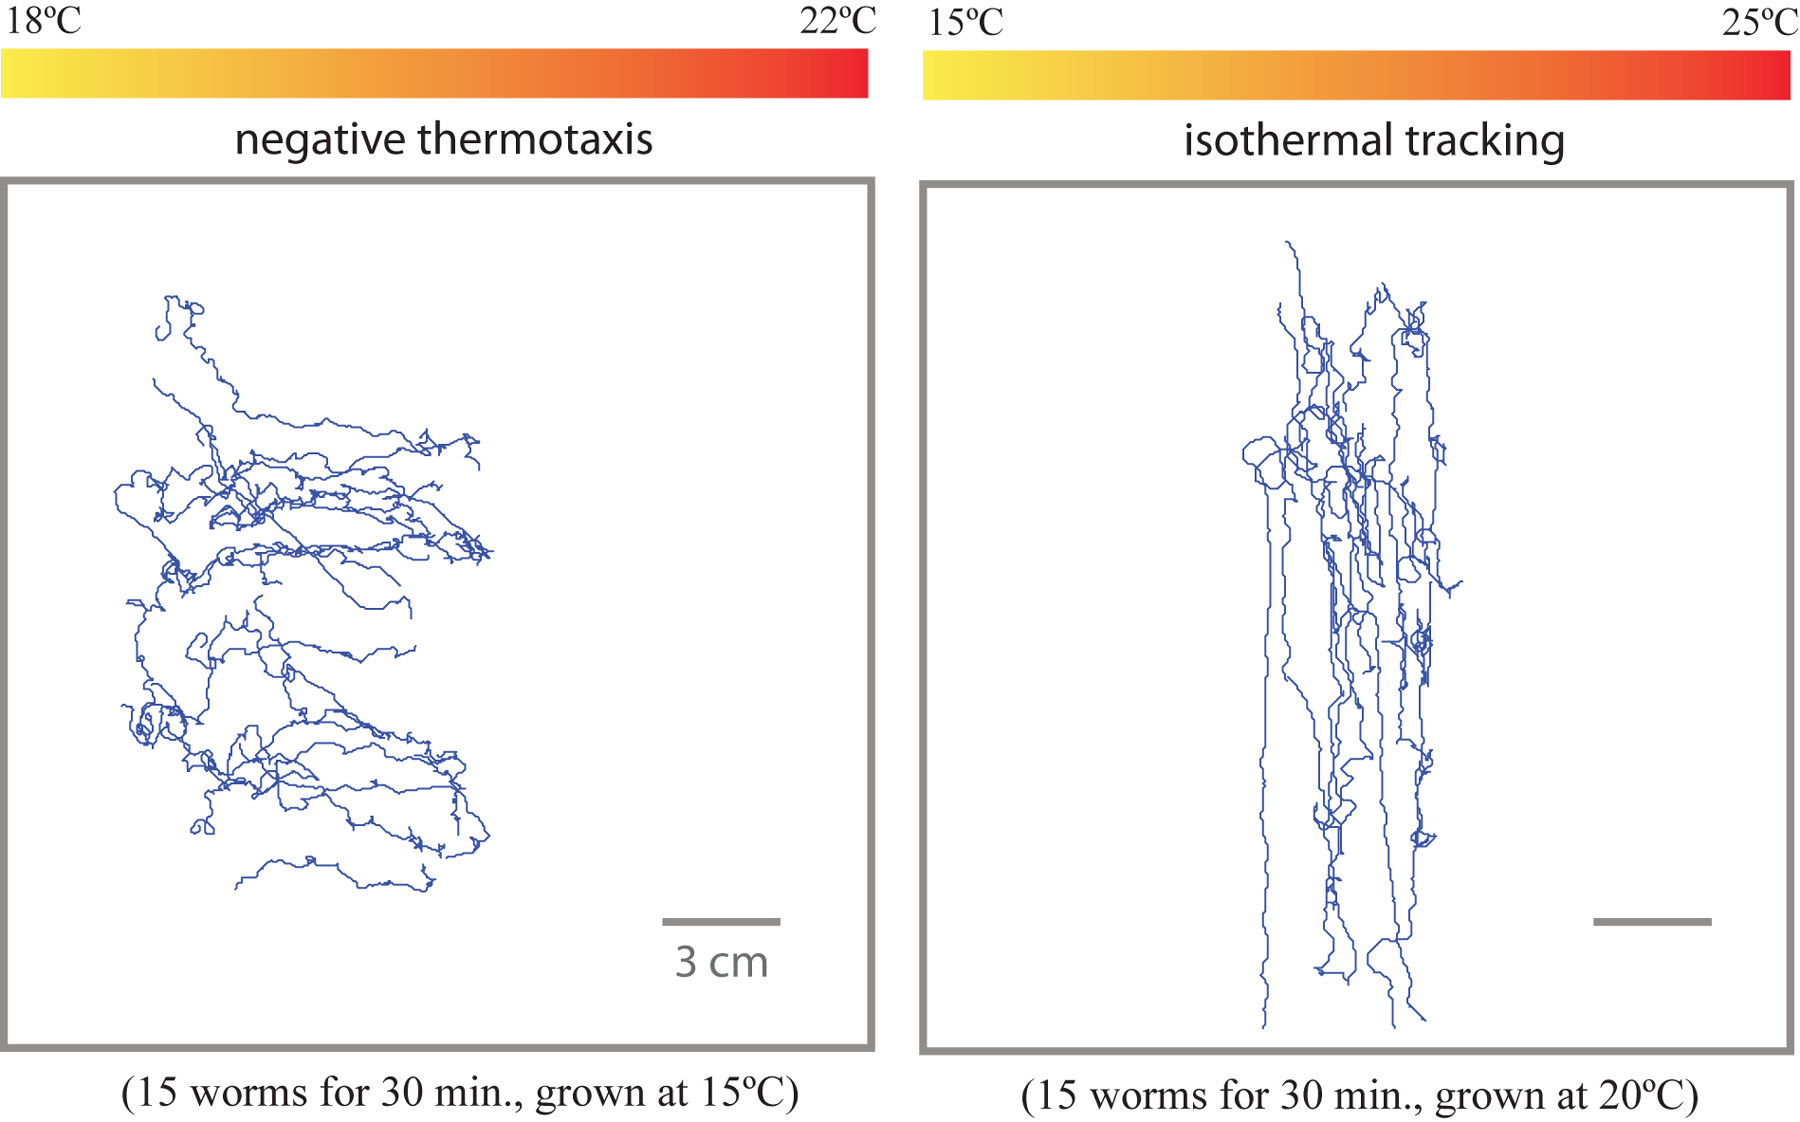
We acquire frames from the CCD camera of worms executing thermotactic migrations along the surface of the agar plate, each experiment using approximately 20 worms and lasting 30 min. In this way, we can measure overall thermotactic drift upwards or downwards on the thermal gradient as well as score individual movements like forward crawling, backward crawling, and turns. The system can also be used to examine isothermal tracking. We have written simple particle-tracking algorithms using LabVIEW Vision Assistant to measure individual crawling trajectories (see Gershow et al., 2012; Omura et al., 2012; Yemini et al., 2011; for freely available image analysis routines). Examples of such trajectories under various experimental conditions are shown in (Figure 4).
|
Figure 4. Resultant tracks from negative thermotaxis and isothermal tracking experiments (Section 5). In the left panel, worms grown at 15°C are placed in the middle at 20°C and robustly navigate to the cold side. In the right panel, worms track isotherms on a steeper gradient centered at their cultivation temperature.
Measurement of thermotactic migration requires setting the worms to a particular Tc. When placed on a spatial thermal gradient, worms will track isotherms in a band of temperatures near Tc and will rapidly and robustly migrate down gradients (negative thermotaxis behavior) when placed above their Tc (Figure 4) (Hedgecock and Russell, 1975). Worms can be set to a specific Tc by growing them overnight at Tc on an NGM plate with OP50. The day of the experiment, rinse several young adult worms in NGM buffer and pick them to a fresh NGM plate, then transfer the worms immediately to the agar slab on the linear thermal gradient. Isothermal tracks should emerge among the worms navigating at temperatures near their Tc. Negative thermotaxis should emerge among the worms navigating at temperatures above their Tc. To determine the thermotaxis or tracking ability of a particular strain normally requires 2-3 independent experiments, although more may be required if the behavior is not robust.
Section 2 contributed by S.L., D.W. and M.B.G.; Section 3 contributed by M.B.G.; Section 4 contributed by I.M.; Section 5 contributed by M.K., L.L. and A.S.; Compiled and edited by P.S.
Beverly, M., Anbil, S., and Sengupta, P. (2011). Degeneracy and neuromodulation among thermosensory neurons contribute to robust thermosensory behaviors in C. elegans. J. Neurosci. 31, 11718-11727. Abstract Article
Chi, C.A., Clark, D.A., Lee, S., Biron, D., Luo, L., Gabel, C.V., Brown, J., Sengupta, P., and Samuel, A.D. (2007). Temperature and food mediate long-term thermotactic behavioral plasticity by association-independent mechanisms in C. elegans. J. Exp. Biol. 210, 4043-4052. Abstract
Clark, D.A., Gabel, C.V., Lee, T.M., and Samuel, A.D. (2007). Short-term adaptation and temporal processing in the cryophilic response of Caenorhabditis elegans. J. Neurophysiol. 97, 1903-1910. Abstract Article
Garrity, P.A., Goodman, M.B., Samuel, A.D., and Sengupta, P. (2010). Running hot and cold: behavioral strategies, neural circuits, and the molecular machinery for thermotaxis in C. elegans and Drosophila. Genes Dev. 24, 2365-2382. Abstract Article
Gershow, M., Berck, M., Mathew, D., Luo, L., Kane, E.A., Carlson, J.R., and Samuel, A.D. (2012). Controlling airborne cues to study small animal navigation. Nat. Methods 9, 290-296. Abstract Article
Glauser, D.A., Chen, W.C., Agin, R., MacInnis, B.L., Hellman, A.B., Garrity, P.A., Tan, M.W., and Goodman, M.B. (2011). Heat avoidance is regulated by transient receptor potential (TRP) channels and a neuropeptide signaling pathway in C. elegans. Genetics 188, 91-103. Abstract Article
Hedgecock, E.M., and Russell, R.L. (1975). Normal and mutant thermotaxis in the nematode Caenorhabditis elegans. Proc. Natl. Acad. Sci. U. S. A. 72, 4061-4065. Abstract
Ito, H., Inada, H., and Mori, I. (2006). Quantitative analysis of thermotaxis in the nematode Caenorhabditis elegans. J. Neurosci. Methods 154, 45-52. Abstract Article
Jurado, P., Kodama, E., Tanizawa, Y., and Mori, I. (2010). Distinct thermal migration behaviors in response to different thermal gradients in Caenorhabditis elegans. Genes Brain Behav. 9, 120-127. Abstract Article
Kimata, T., Sasakura, H., Ohnishi, N., Nishio, N., and Mori, I. (2012). Thermotaxis of C. elegans as a model for temperature perception, neural information processing and neural plasticity. Worm 1, 31-41. Abstract Article
McCormick, K.E., Gaertner, B.E., Sottile, M., Phillips, P.C. and Lockery, S. (2011) Microfludic devices for analysis of spatial orientation behaviors in semi-restrained Caenorhabditis elegans. PLoS One, e25710. Abstract Article
Mori, I., and Ohshima, Y. (1995). Neural regulation of thermotaxis in Caenorhabditis elegans. Nature 376, 344-348. Abstract Article
Murakami, H., Bessinger, K., Hellmann, J., and Murakami, S. (2005). Aging-dependent and -independent modulation of associative learning behavior by insulin/insulin-like growth factor-1 signal in Caenorhabditis elegans. J. Neurosci. 25, 10894-10904. Abstract
Omura, D.T., Clark, D.A., Samuel, A.D., and Horvitz, H.R. (2012). Dopamine signaling is essential for precise rates of locomotion by C. elegans. PLoS One 7, e38649. Abstract Article
Ramot, D., MacInnis, B.L., Lee, H.C., and Goodman, M.B. (2008). Thermotaxis is a robust mechanism for thermoregulation in Caenorhabditis elegans nematodes. J. Neurosci. 28, 12546-12557. Abstract Article
Ryu, W.S., and Samuel, A.D. (2002). Thermotaxis in Caenorhabditis elegans analyzed by measuring responses to defined thermal stimuli. J. Neurosci. 22, 5727-5733. Abstract
Yamada, Y., and Ohshima, Y. (2003). Distribution and movement of Caenorhabditis elegans on a thermal gradient. J. Exp. Biol. 206, 2581-2593. Abstract Article
Yemini, E., Kerr, R.A., and Schafer, W.R. (2011). Preparation of samples for single-worm tracking. Cold Spring Harb. Protoc. 2011, 1475-1479. Abstract Article
Zariwala, H.A., Miller, A.C., Faumont, S. and Lockery, S.R. (2003) Step response analysis of thermotaxis in Caenorhabditis elegans. J. Neurosci. 10, 4369-4377. Abstract
Zhao, B., Khare, P., Feldman, L., and Dent, J.A. (2003). Reversal frequency in Caenorhabditis elegans represents an integrated response to the state of the animal and its environment. J. Neurosci. 23, 5319-5328. Abstract
*Edited by: Oliver Hobert Last revised: February 26, 2013, Published February 20, 2014. This chapter should be cited as: Goodman M. B., Klein M., Lasse S., Luo L., Mori I., Samuel A., Sengupta P., Wang D. Thermotaxis navigation behavior (February 20, 2014), WormBook, ed. The C. elegans Research Community, WormBook, doi/10.1895/wormbook.1.168.1, http://www.wormbook.org.
**Authors listed alphabetically, see Section 6 for individual author contributions.
Copyright: © 2014 Miriam B. Goodman, Mason Klein, Samuel Lasse, Linjiao Luo, Ikue Mori, Aravi Samuel, Piali Sengupta, Dong Wang. This is an open-access article distributed under the terms of the Creative Commons Attribution License, which permits unrestricted use, distribution, and reproduction in any medium, provided the original author and source are credited.
§To whom correspondence should be addressed. Email: Miriam B. Goodman mbgoodman@stanford.edu, Linjiao Luo linjiao@nju.edu.cn, Ikue Mori m46920a@nucc.cc.nagoya-u.ac.jp, Piali Sengupta sengupta@brandeis.edu
 All WormBook content, except where otherwise noted, is licensed under a Creative Commons Attribution License.